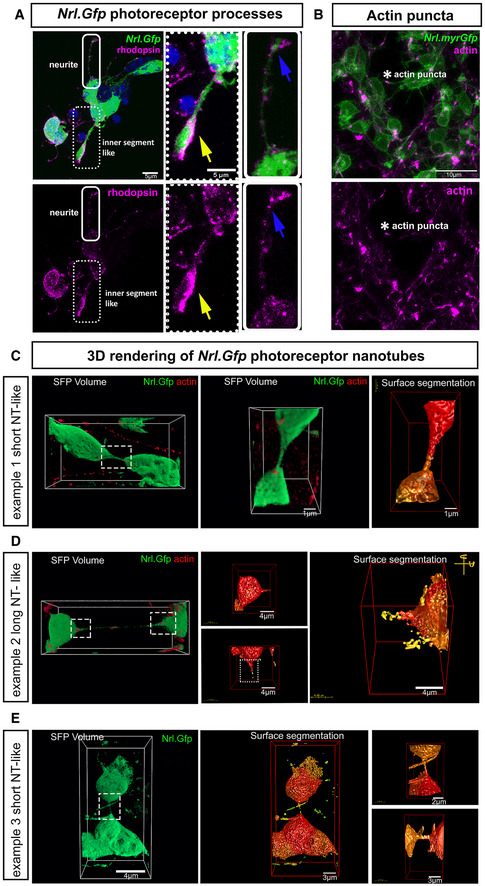
Figure EV2. Photoreceptors form nanotube‐like processes in culture.

-
ARepresentative MIP example of rhodopsin immunostaining of fixed Nrl.Gfp+/+ photoreceptors at 6 DIC. Digitally enhanced microphotographs of a neurite (solid line rectangle) and an inner segment‐like process (dotted rectangle), showing strong rhodopsin staining in the bulbous inner segment‐like structure (yellow arrow), compared to more dispersed staining in a neurite (blue arrows). Green = myrGFP, Magenta = Rhodopsin; Scale bar = 5 µm.
-
BRepresentative MIP example of live imaging of P8 Nrl.Cre+/− × mTmG +/+ (myrGFP) photoreceptor processes. SiR‐actin (magenta) reveals the presence of actin puncta (white asterisk) at the point of contact between a nanotube‐like process (herein termed PhNTs) and an adjacent photoreceptor. Green = myrGFP, Magenta = SiR‐actin; Scale bar = 10 µm.
-
C–ERepresentative 3D deconvolved images of PhNTs from Nrl.Gfp+/+ (green) P8 photoreceptor live‐imaged at DIV1–3 and labelled with SiR‐actin (red). (C) (left) Simulated Fluorescence Process (SFP) image of an example of a short PhNT and (middle, right) digitally enhanced 3D rendered surface per volume images of the same PhNT in rotation; Scale bar = 1 µm; (D) (left) SFP image of an example of a long PhNT and (middle, right) digitally enhanced 3D rendered surface per volume images of the same PhNT in rotation. Representative images from N = 7 independent cultures. Scale bar = 4 µm; (E) (left) SFP and (middle, right) digitally enhanced 3D rendered surface per volume images of the PhNT shown in Fig 3J. Scale bar = 4 µm; 3 µm; 2 µm; 3 µm, respectively, from left to right.
