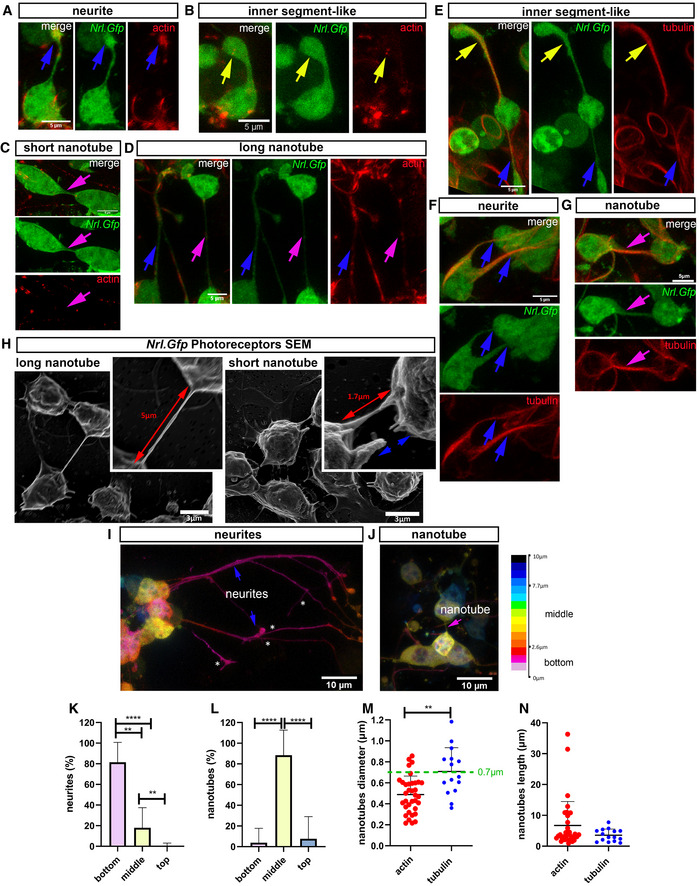
Figure 3. Photoreceptors form nanotube‐like processes to connect with neighbouring photoreceptors in culture.

-
A–DRepresentative 3D deconvolved MIP images from live imaging of Nrl.Gfp+/+ (green) P8 photoreceptors at DIV1–3, labelled with SiR‐actin (red) (N = 7 independent cultures). Photoreceptors exhibit a variety of processes, including (A) neurites (blue arrow), (B) nascent inner segment‐like protrusions (yellow arrow), and (C) short and (D) long (magenta arrows) actin+ve nanotube‐like (herein termed PhNTs) connections; Scale bar = 5 µm.
-
E–GRepresentative 3D deconvolved MIP images from live imaging of Nrl.Gfp+/+ (green) P8 photoreceptors at DIV1–3 labelled with SiR‐tubulin (red) (N = 7 independent cultures). Photoreceptors exhibit a variety of processes, including nascent inner segment‐like protrusions (yellow arrows), neurites (blue arrows) and rare tubulin+ve PhNTs (magenta arrows); Scale bar = 5 µm.
-
HRepresentative SEM images with digitally enhanced microphotographs of cultured P8 Nrl.Gfp+/+ photoreceptors. Red arrows indicate PhNT connections between neighbouring photoreceptors, while blue arrows indicate broken PhNT connections (N = 3 cultures). Scale bar = 5 µm.
-
I, JRepresentative images of depth colour coding (ImageJ) of x,y,z live imaging of Nrl.Gfp+/+ photoreceptor cultures showing (I) neurites (blue arrows) growing along the substrate (asterisks denote secondary branching of long GFP+ neurites), and in (J), a free‐floating PhNT (magenta arrow). Scale bar = 10 µm.
-
K, LQuantification of the localization of Nrl.Gfp+/+ processes in the z‐axis (depth) (N = 4 independent cultures, n = 1,096 cells, n neurites = 440, n nanotubes = 31) where (K) neurites. P‐values = ****P < 0.0001 (bottom vs top); **P = 0.002 (bottom vs middle); **P = 0.003 (middle vs top) and (L) PhNTs; P‐values = ****P < 0.0001 (bottom vs middle & middle vs top). One‐way ANOVA, non‐parametric, Kruskal–Wallis with Dunns’ multiple comparisons test shows means vary significantly.
-
M, NDiameter and length quantification of SiR‐actin+ve PhNTs (N = 7 cultures; n cells = 646 cells; n nanotubes = 35, red dots) compared to SiR‐tubulin+ve PhNTs (N = 7 cultures; n cells = 885 cells, n nanotubes = 15; blue dots). One‐way ANOVA, non‐parametric, Kolmogorov–Smirnov test shows non‐significant (ns) difference in length but significant difference in diameter between actin+ve versus tubulin+ve PhNTs. P‐values; **P = 0.001, and P = 0.245, in (M) and (N), respectively.
Data information: Graphs show mean ± SD.
