-
A, B
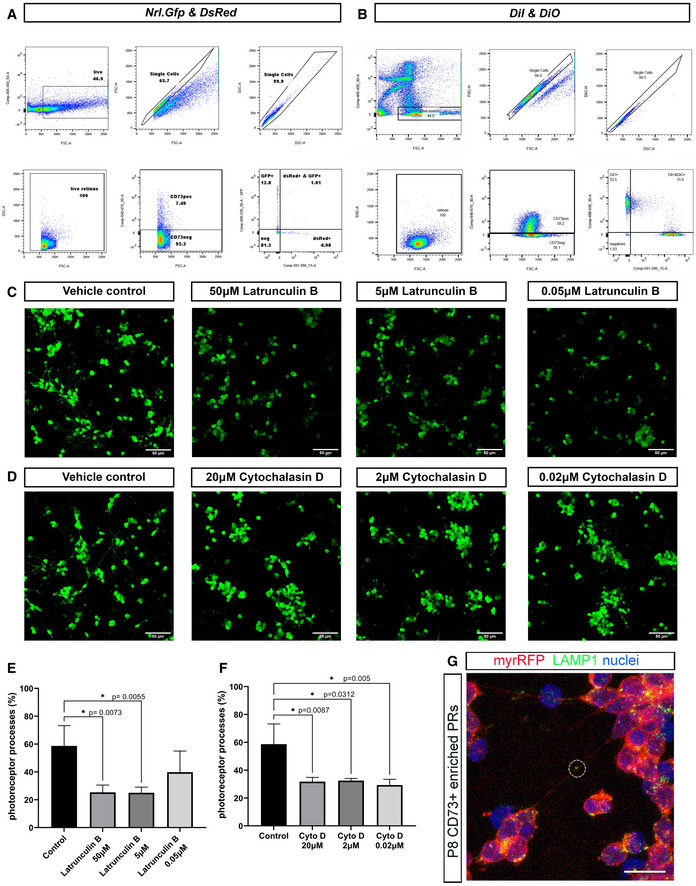
Flow cytometry gating strategy of either (A) co‐cultures of Nrl.Gfp and DsRed cells, or (B) DiI and DiO labelled cells. In each case, panels reading top left to bottom right are: 1. Live cells selection, 2. Single events in FSC, 3. More single events in SSC, 4. Single live events in FSC/SSC, 5. CD73−APC versus FSC, 6. Nrl.Gfp+
vs DsRed+
within the CD73APC+ population (for A) or 6. DiI+ vs DiO+ within the CD73APC+ population (for B).
-
C, D
Representative examples of confocal imaging of P8 Nrl.Gfp+/+
photoreceptors fixed after 48 h exposure to different concentrations of the actin polymerization inhibitors (C), Latrunculin B (50 µM, 5 µM and 0.05 µM) and (D), Cytochalasin D (20 µM, 2 µM and 0.02 µM), compared to vehicle controls (DMSO); Scale bars = 50 µm.
-
E, F
Statistical analysis of the percentage of photoreceptors exhibiting processes following 48 h treatment with Latrunculin B (50 µM, 5 µM and 0.05 µM) or Cytochalasin D (20 µM, 2 µM and 0.02 µM), compared to vehicle control. One‐way ANOVA non‐parametric, two‐tailed analysis, F‐test, Kolmogorov–Smirnov, *P < 0.05 shows significant effect of both drugs on the ability of photoreceptors to elaborate processes, compared to vehicle control; (N = 3 independent cultures, n = 1 well per condition). Graph shows mean ± SD.
-
G
Representative MIP of myrRFP+ve/CD73+ve photoreceptors (red) immunostained for LAMP1 (green) after 3DIC; Circle = LAMP1+ve vesicle in long PhNTs. Scale bar = 10 µm.

