
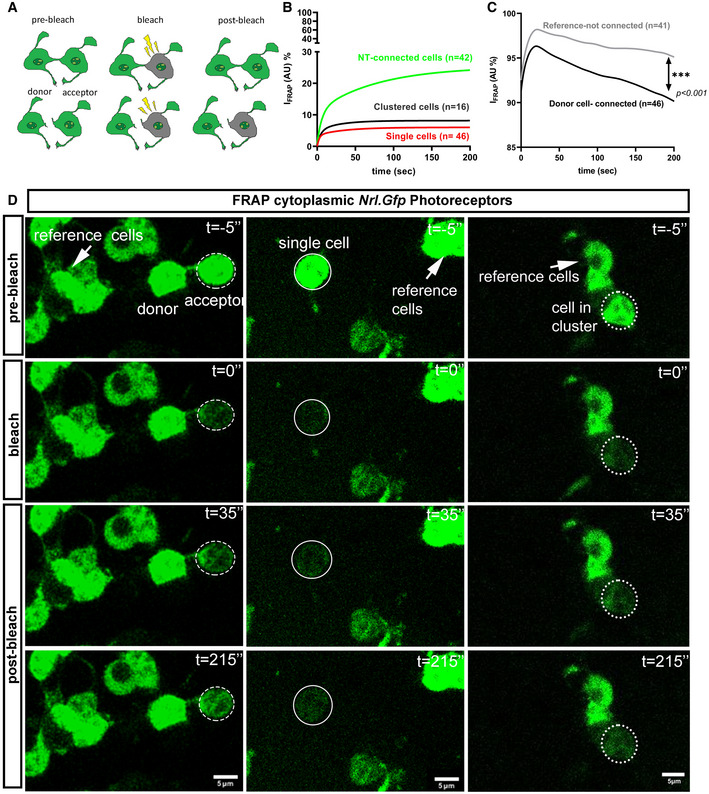
Figure 4. PhNTs facilitate recovery after photobleaching in culture.
-
ASchematic representation of cytoplasmic (c)GFP mobility during fluorescence recovery after photobleaching (FRAP).
-
BFRAP recovery curves for PhNT‐connected cells (green, n = 42, R 2 = 0.99), clustered cells (black, n = 16, R 2 = 0.94) and single cells (red, n = 46, R 2 = 0.97); Mann–Whitney analysis of fit for curves.
-
CFRAP recovery curves in unbleached reference cells (black, n = 41) versus “donor” PhNT‐connected photoreceptor cells (purple, n = 46) show significant slope difference. Mann–Whitney analysis of fit for curves, ***P < 0.001.
-
DRepresentative time‐lapse images of cGFP mobility between two PhNT‐connected Nrl.Gfp+/+ photoreceptors (dashed ellipse = bleached area) versus an isolated cell (solid ellipse = bleached area) and clustered cells (dot ellipse = bleached area). Images show pre‐bleach (t = −5’’), bleach (t = 0’’) and post‐bleach (t = 35’’ and 215’’). Unbleached reference cells also indicated (arrows); Green = cytoplasm; Scale bar = 5 µm.