
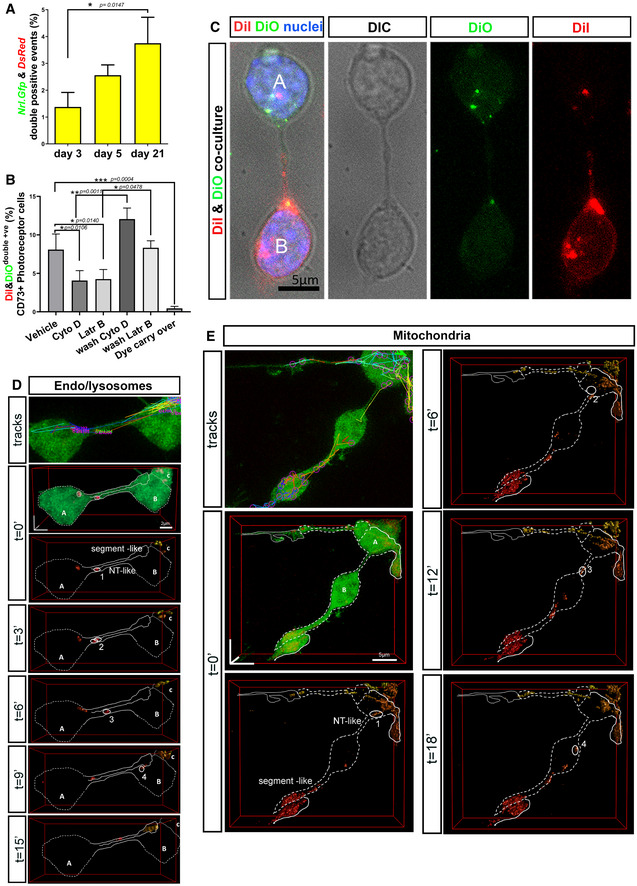
Figure 5. PhNTs enable the intercellular transfer of cytoplasmic and membrane reporters and, rarely, organelles, in culture.
-
AFlow cytometry analysis of cGFP and cDsRed following co‐culture of Nrl.Gfp and DsRed cells (1:1) and analysed at 3 DIC (N = 3 independent co‐cultures with a technical triplicate), 7 DIC (N = 5), 21 DIC (N = 4); one‐way ANOVA non‐parametric, Kruskal–Wallis.
-
BFlow cytometry analysis of DiI/DiO dual labelling of CD73+ cells following co‐culture of DiI‐ and DiO‐labelled photoreceptors (1:1) with pharmacological interventions applied at 5 DIC for 48 h, including vehicle control (DMSO), cytochalasin D (2 μM) and Latrunculin B (5 μM), after wash‐off of Cyto D and LatrB, and a final wash control for DiI/DiO carry over; N = 4 independent co‐cultures per condition; one‐way ANOVA non‐parametric, F‐test, Kolmogorov–Smirnov.
-
CRepresentative MIP of DiI/DiO co‐cultures after fixation, showing DiO+ve cell (A) and a DiI+ve cell (B) cell connected by a PhNT. Note DiI and DiO puncta in the respective acceptor cells. Blue = Dapi (nuclei), Green = DiO, Red = DiI. Scale bar = 5 µm.
-
DLysosomes can be exchanged, rarely, between PhNT‐connected cells. Lysosomes were labelled with SiR‐Lyso, and their movements were analysed by TrackMate software. Images show deconvolution of 3D reconstructions of lysosomes (surface; red) and cGFP (volume; green) from time‐lapse live imaging series of Nrl.Gfp+/+ photoreceptor cultures (green); the position of a transferred lysosome is marked as1 (t = 0), 2 (t = 3’), 3 (t = 6’), 4 (t = 9’); N.B. Deconvolution shows a segment‐like process extending from cell “A” and a PhNT connecting cells “A” and “B”; Scale bar = 2 µm.
-
EMitochondria can be exchanged, rarely, between PhNT‐connected cells. Mitochondria movements determined by TrackMate software. Images show deconvolution of 3D reconstructions of mitochondria (surface; red) and cGFP(volume; green) from time‐lapse live imaging series; position of transferred mitochondrion is marked as 1 (t = 0), 2 (t = 6’), 3 (t = 12’), 4 (t = 18’); Mitochondria labelled with mito‐Tracker‐Orange; Scale bar = 5 µm.
Data information: Graphs show mean ± SD.