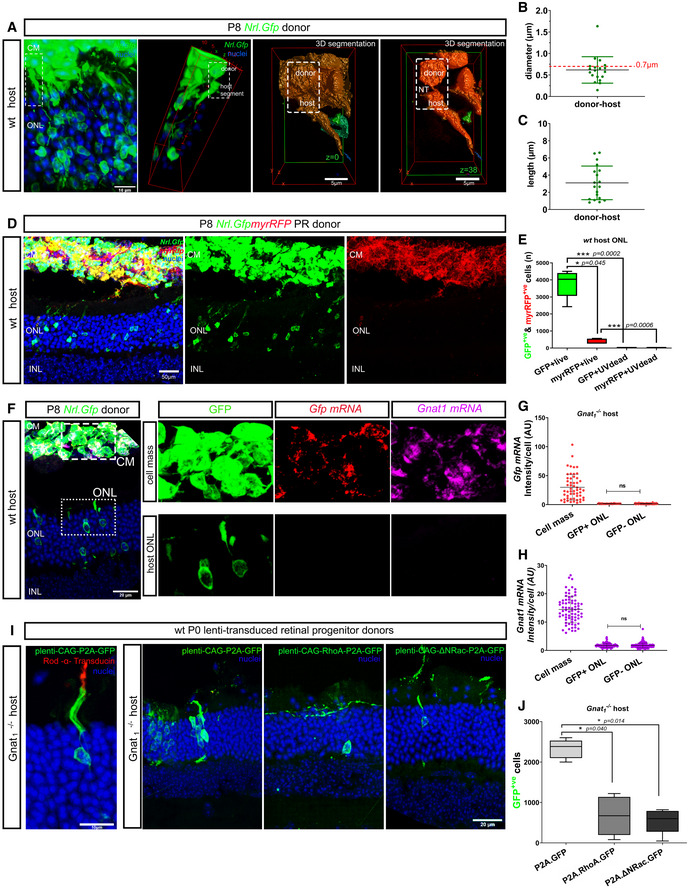
Figure 6. Transplanted photoreceptors form PhNT processes with host photoreceptors and transfer cytoplasmic and membrane proteins but transfer of mRNA was not detected.

-
AMIP image of wild‐type (wt) retina transplanted with P8 Nrl.Gfp+/+ CD73+ MACS‐enriched photoreceptors; dashed box indicates ROI subjected to 3D deconvolution and volume reconstruction (right) and shows PhNT‐like connection between donor and host photoreceptor at the level of host inner segment. Additional images show 3D segmentation of z = 0 and z = 38 focal planes, and reveal the PhNT; green = GFP, blue = nuclei; Scale bar = 10 µm in MIP and 5 µm volume reconstruction.
-
B, CAssessment of properties of PhNT‐like processes between donor and host photoreceptors (n = 19 PhNT‐like processes; N = 10 eyes) showing (B) diameter and (C) length.
-
DMIP image of wt retina transplanted with P8 Nrl.Gfp+/+ x myrRFP/+ photoreceptors; showing wt host ONL photoreceptor labelled with cGFP (green) but not with myrRFP (red); Scale bar = 50 µm.
-
EQuantification and statistical analysis of material transfer events following subretinal transplantation of live (cGFP = 3,775 ± 804, myrRFP = 436 ± 145) or UV‐treated (cGFP = 1.3 ± 2.5, myrRFP = 4.3 ± 5.7) Nrl.Gfp+/+x myr‐Rfp +/+ photoreceptors into wt hosts (N = 8 and N = 4 retinae, respectively); one‐way ANOVA, parametric, two‐tail, Tukey’s multiple comparisons; graph shows mean ± SD.
-
F–HAssessment of potential for transfer of donor Gfp and Gnat1 mRNA during transplantation using RNAscope™. (F) Representative MIP images of Gnat1 −/− eyes transplanted with Nrl.Gfp+/+ donor cells and processed in situ for Gfp mRNA (red) and Gnat1 mRNA (magenta); blue = nuclei; ROIs indicated in (F) show GFP+ve donor cell mass (CM) and GFP+ve cells within Gnat1 −/− host outer nuclear layer (ONL). G, H Quantification of Gfp and Gnat1 mRNA (mean fluorescence intensity per cell), respectively (N = 3 retinae); one‐way ANOVA, non‐parametric, two‐tailed analysis showed no significant differences in signal intensity for either Gnat1 or Gfp mRNA between GFP+ve and GFP−ve host photoreceptors.
-
IManipulation of actin signalling alters material transfer in vivo: (far left) MIP image showing GFP+ve host photoreceptor (green) expressing Rod α‐transducin (red) after transplantation of retinal cells transduced with lenti‐CAG‐P2A.Gfp (transduction control) into Gnat1 −/− recipient; scale bar = 10 µm; adjacent images show Gnat1 −/− eyes transplanted with P2 retinal cells transduced with (left) plenti‐CAG‐P2A.GFP (green), or (middle) plenti‐CAG‐RhoA‐P2A.GFP (green), or (right) plenti‐CAG‐ΔΝRac1‐P2A.GFP (green); green = GFP, blue = nuclei; Scale bar = 20 µm.
-
JQuantification of the number of GFP+ cells in Gnat1 −/− host ONL, (N = 5 retinae per condition); plenti‐CAG‐P2A.GFP (2,328 ± 234), plenti‐CAG‐RhoA‐P2A.GFP (668 ± 481), plenti‐CAG‐ΔΝRac1‐P2A.GFP (547 ± 306); one‐way ANOVA, non‐parametric, Dunn’s multiple comparisons test. Graph shows mean ± SD.
Data information: CM = cell mass; all eyes were processed 3 weeks post‐transplantation. RPE—Retinal Pigment Epithelium; ONL—outer nuclear layer; INL—inner nuclear layer; GCL—Ganglion Cell Layer. Graphs show mean ± SD.
