Figure 5.
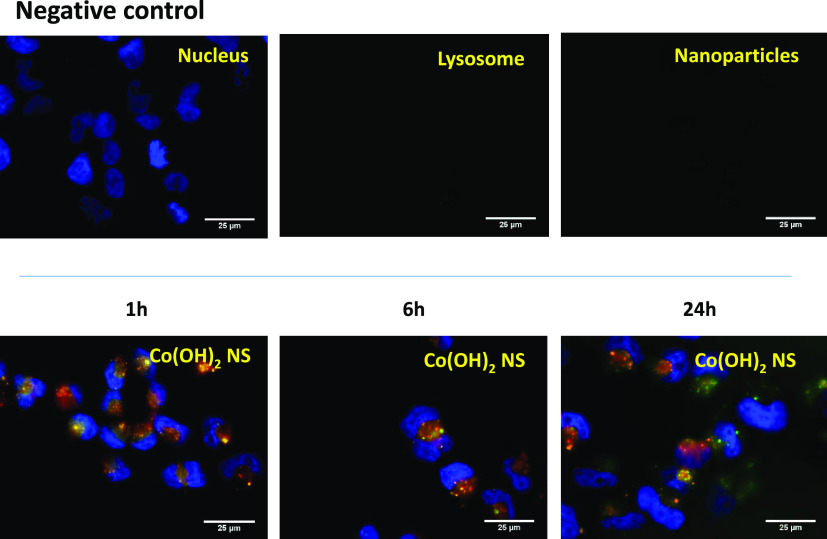
LysoTracker analysis of Co(OH)2 NS for cell internalization study. Fluorescence microscopy images of rhodamine-labeled CO(OH)2 NS in A2780 ovarian cancer cells after 1, 6, and 24 h, from the left to the right, respectively. Negative control (only nuclei staining, top) was used to set up fluorescence intensity and avoid background signal. The panels in each row show fluorescence from Hoescht 33342 (nuclei stained blue), LysoTracker Green (lysosome stained green), and rhodamine B (CO(OH)2 NS stained red) and merged images. In merged images, the colocalization of rhodamine with LysoTracker Green appears as yellow areas.

