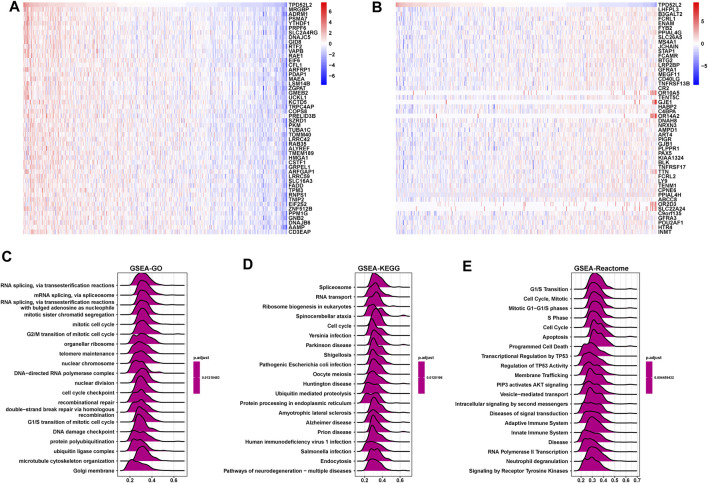
FIGURE 6.
GSEA of TPD52L2. (A) Expression of top 50 genes positively correlated with TPD52L2 expression in LUAD. (B) Expression of top 50 genes negatively correlated with TPD52L2 expression in LUAD. (C) The top 20 GSEA-GO results are shown in LUAD. (D) The top 20 GSEA-KEGG results are shown in LUAD. (E) The top 20 GSEA-Reactome results are shown in LUAD.

