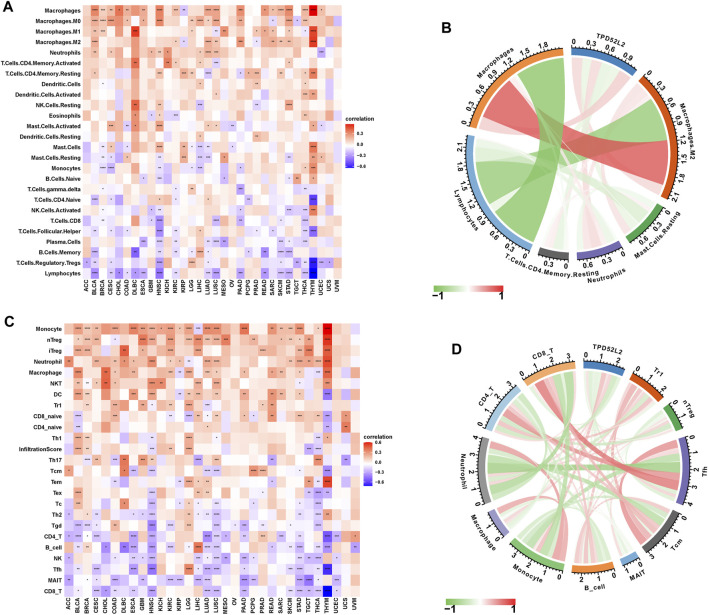
FIGURE 7.
Immune infiltration analysis. (A) Correlation between TPD52L2 expression and infiltration levels of 26 immune cells downloaded from a published work in pan-cancer. Red represents positive correlation, blue represents negative correlation, and the darker the color, the stronger the correlation. (B) Correlation between TPD52L2 expression and indicated immune cells downloaded from a published work in LUAD. (C) Correlation between TPD52L2 expression and infiltration levels of 24 immune cells from ImmuCellAI in pan-cancer. (D) Correlation between TPD52L2 expression and indicated immune cells in the ImmuCellAI cohort in LUAD.

