
Fig. 1. Phenotypic continuum of T cell states between the blood and CSF.
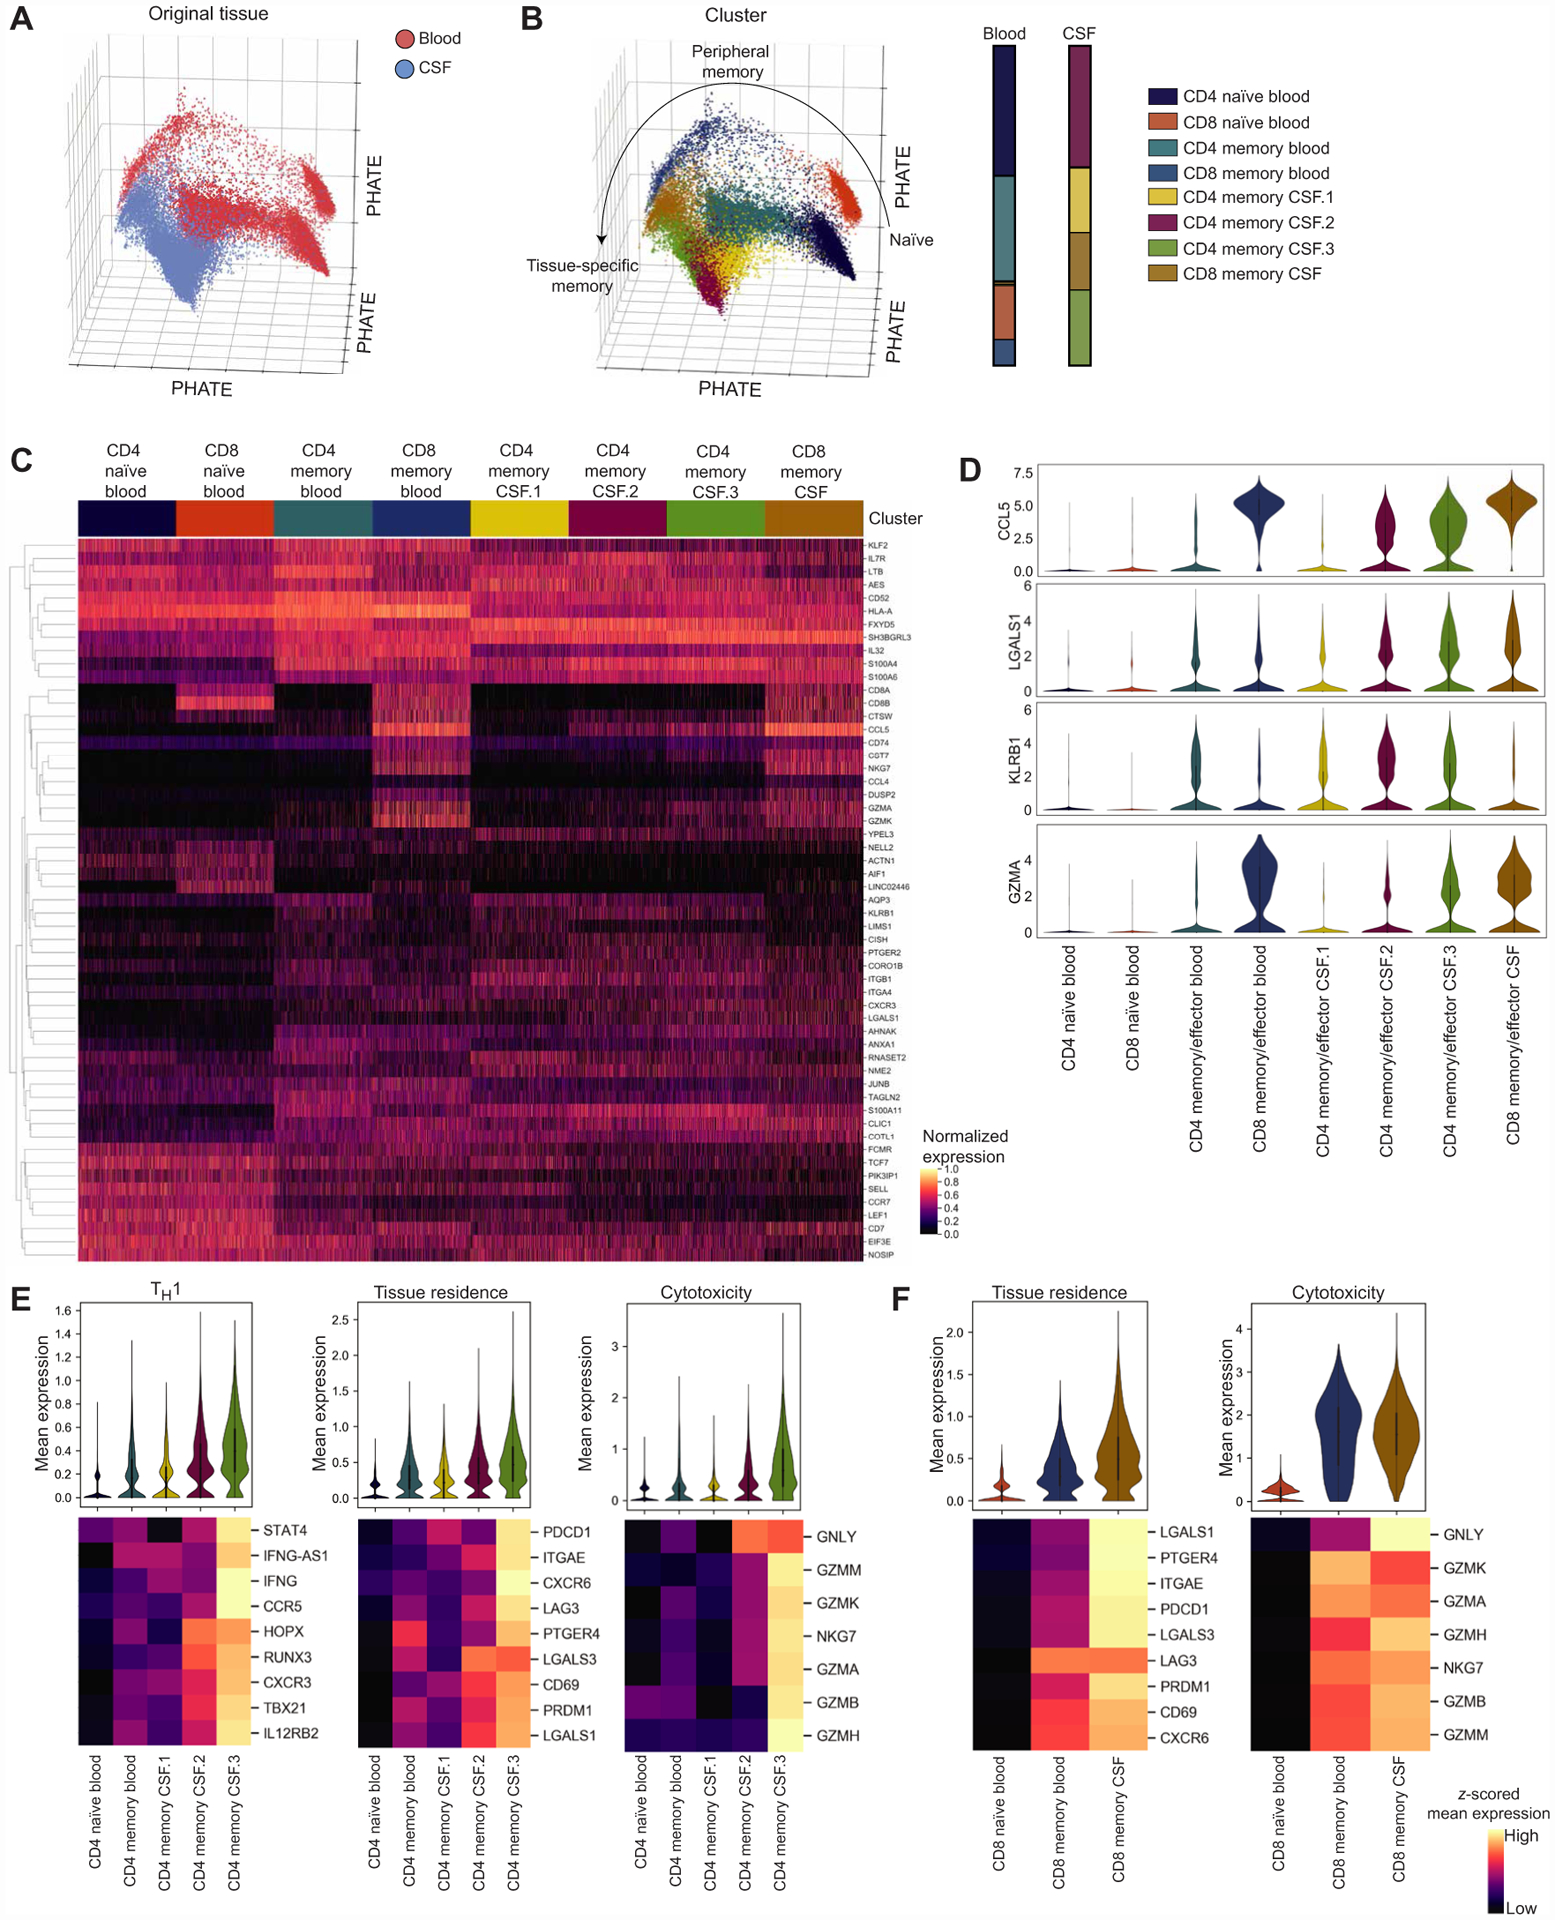
(A) Progression-preserving PHATE visualization of 16,752 T cells from the blood and 14,043 T cells from the CSF of healthy individuals (n = 6 healthy donors) colored by the tissue of origin. (B) PHATE visualization of healthy T cells colored by PhenoGraph clusters with bar graphs showing the composition of T cell clusters in the blood and CSF. Clusters are named if it contains CD4 or CD8 and naïve or memory (antigen-experienced) cells and the tissue where the cluster was predominantly present. (C) Heatmap of standard-scaled expression of the top 10 differentially expressed genes in each cluster in 1000 randomly sampled cells per cluster. Each column is a cell, and genes were hierarchically clustered. (D) Violin plots of expression for select genes presented in (C). (E) Violin plots of mean expression of genes related to TH1 function, tissue residence, and cytotoxicity for each cell in CD4 T cell clusters. Heatmaps show z-scored mean for each gene included in the gene module for each cluster, and genes were hierarchically clustered. CD4 memory CSF.2 and CD4 memory CSF.3 were compared with each other and all other CD4 clusters using a Kruskal-Wallis test with Dunn’s multiple comparisons correction. Full statistics are shown in table S2. (F) Violin plots of mean expression of genes related to tissue residence and cytotoxicity for each cell in CD8 T cell clusters. Heatmaps show z-scored mean expression for each gene included in the gene module for each cluster, and genes were hierarchically clustered. CD8 memory CSF was compared with both other CD8 clusters using a Kruskal-Wallis test with Dunn’s multiple comparisons correction. Full statistics are shown in table S2.