
Fig. 4. Characterization of clonally expanded T cells in healthy CSF.
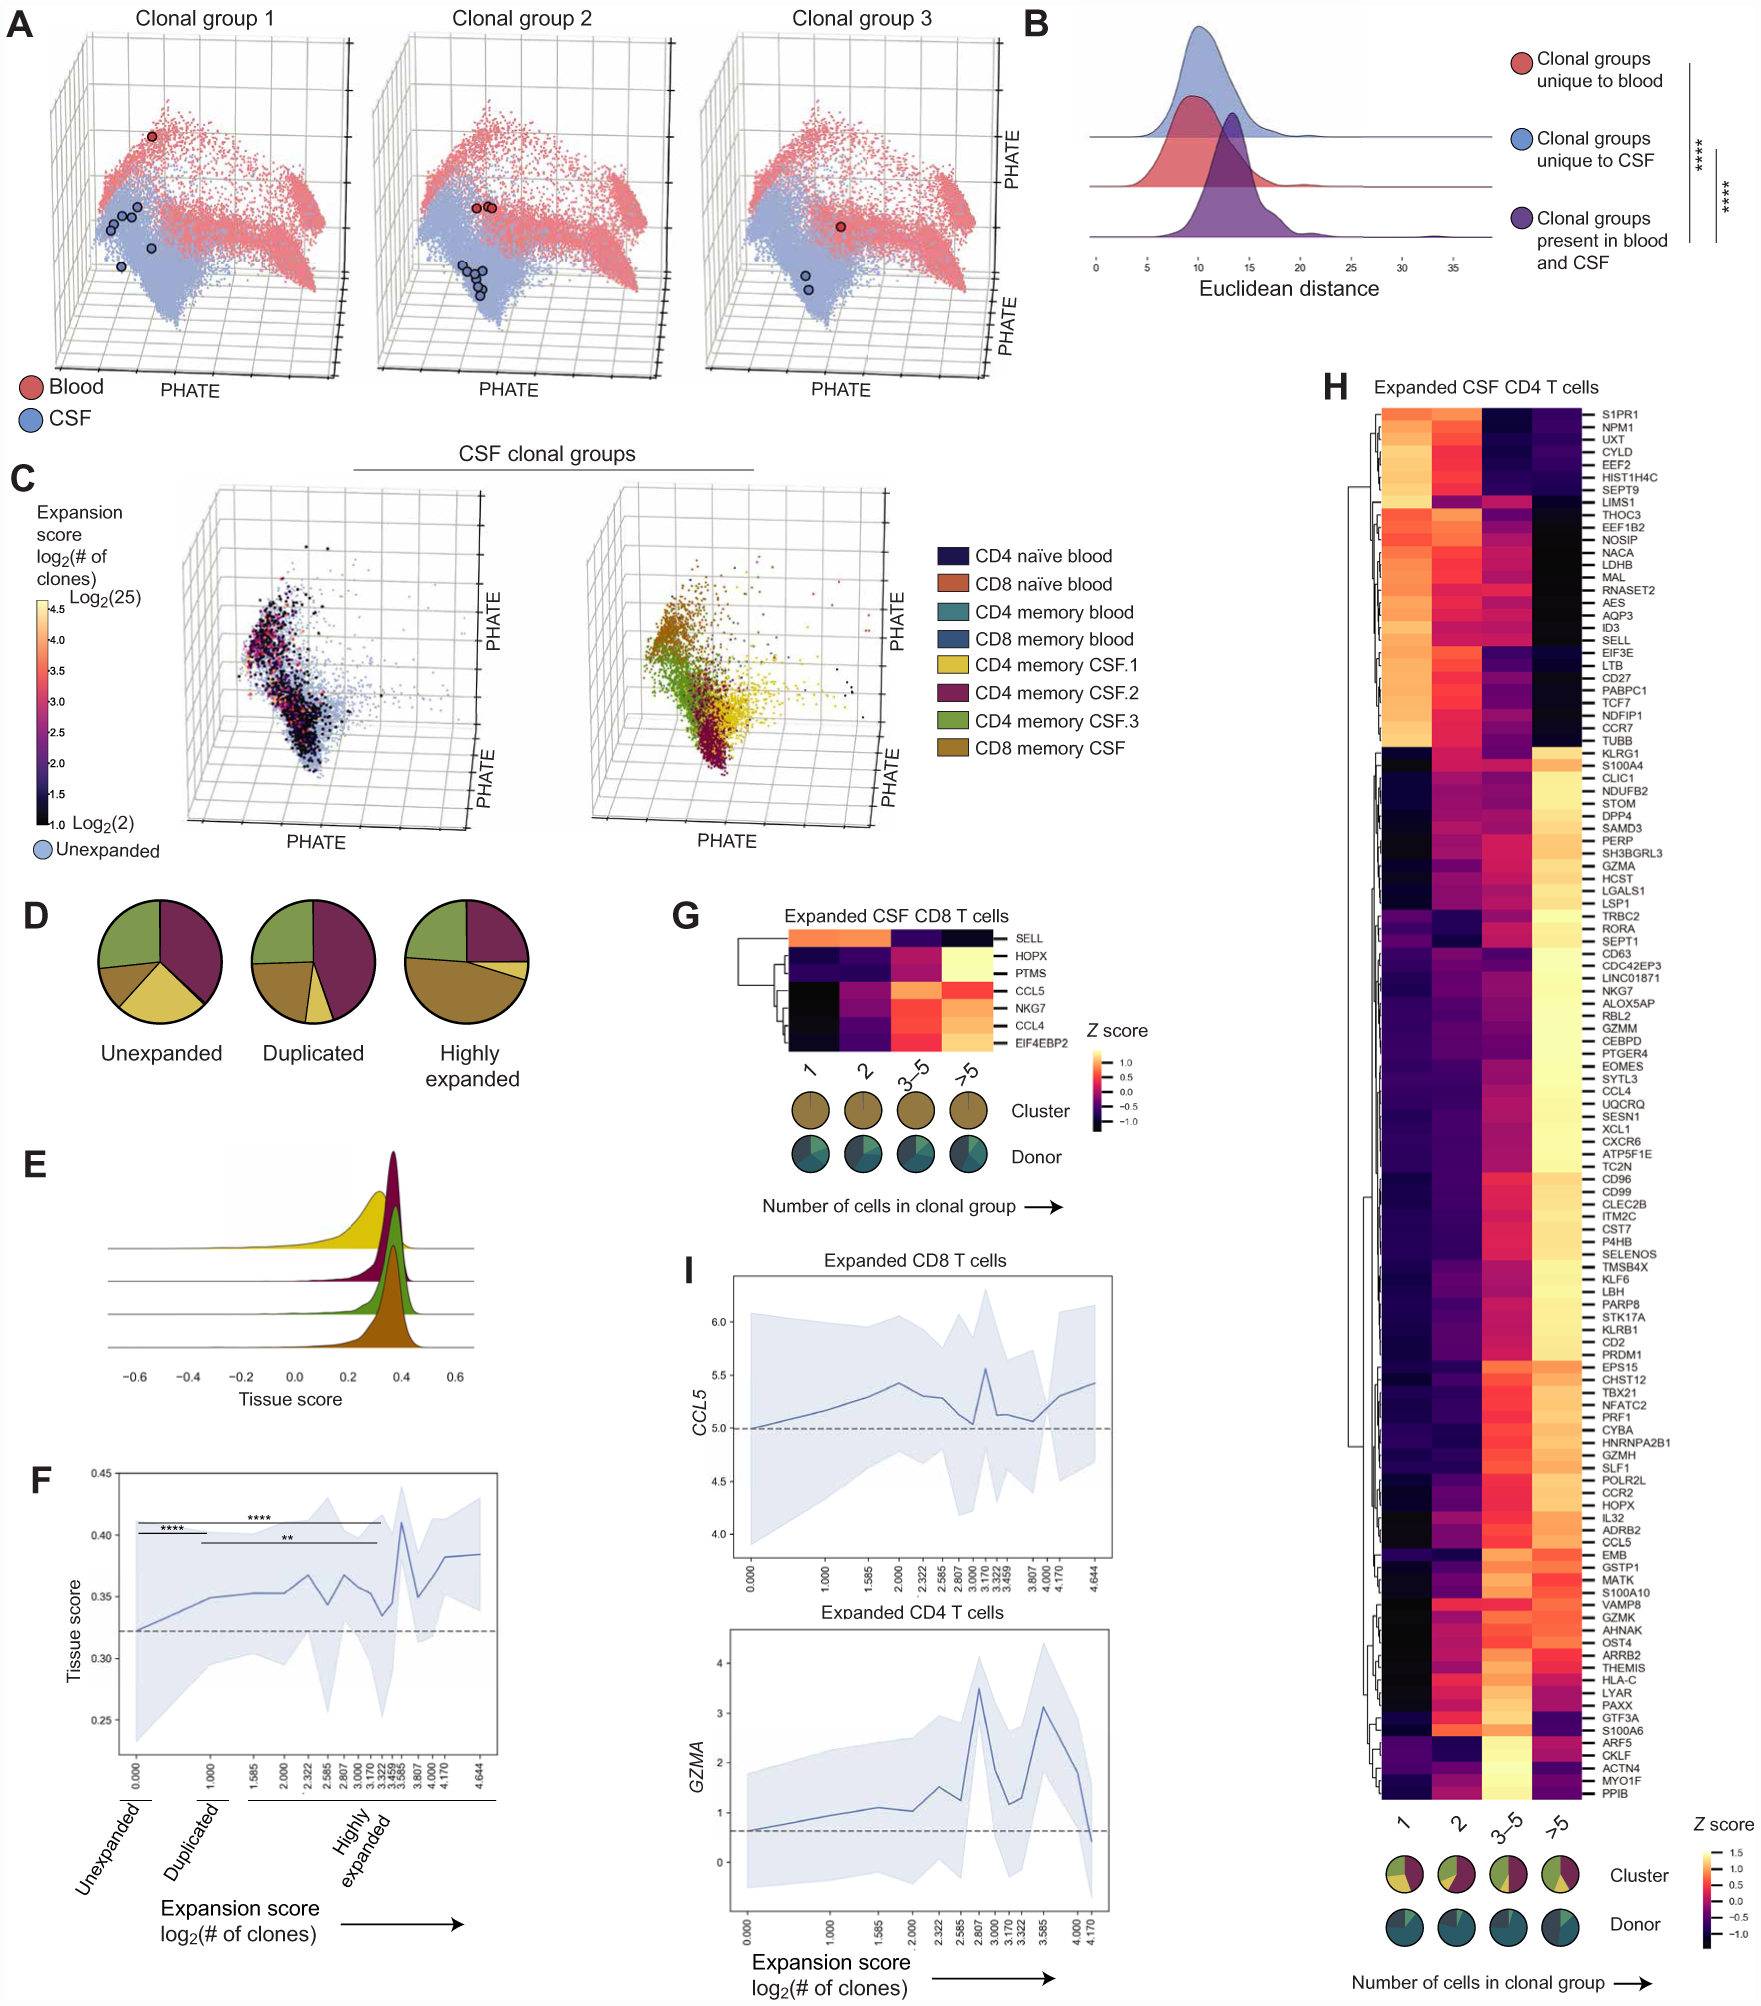
(A) PHATE visualization with three representative groups from three different donors of clonal groups with cells present in both the blood and CSF (fig. S5). (B) Joy plot showing Euclidean distances between the first 20 PCs of cells in the same clonal group but present in different tissues (purple; 284 clonal groups, n = 6 donors) or cells from clonal groups only in the blood (red; 129 clonal groups, n = 6 donors) or CSF (blue; 448 clonal groups, n = 5 donors). Distances compared by the Kruskal-Wallis test with Dunn’s multiple comparisons correction. ****P < 0.0001. (C) PHATE visualization showing CSF T cells where a TCR (CDR3α/CDR3β) was recovered, including unexpanded cells and expanded cells colored by the expansion score or log2(number of clones) in each group (left). PHATE visualization showing CSF T cells where a TCR was recovered colored by cluster (right). (D) Cluster distribution of unexpanded (7199 CSF T cells), duplicated (2 cells per clonal group, 792 CSF T cells), and highly expanded (>2 cells per clonal group, 708 CSF T cells) CSF T cells in healthy individuals where clonally expanded cells were present (n = 5 donors; fig. S5). Two-way analysis of variance (ANOVA) with Tukey’s multiple comparison correction (adjusted P values): CD4 memory CSF.1 (unexpanded > duplicated, P = 0.0021; unexpanded > highly expanded, P = 0.0007), CD4 memoryCSF.2 (unexpanded > highly expanded, P = 0.0021; duplicated > highly expanded, P = 0.0028), CD8 memory CSF (unexpanded < duplicated, P = 0.0051; unexpanded < highly expanded, P < 0.0001; duplicated < highly expanded, P < 0.0001). (E) Subset of the joy plot shown in Fig. 2B of tissue scores for T cell clusters predominantly in the CSF. Kruskal-Wallis test with Dunn’s multiple comparisons correction between the tissue score for CD4 memory CSF.1 and three other clusters predominantly in the CSF. P < 0.0001 for all comparisons. (F) Line plot of the mean tissue score and SD for each expansion score (n = 5 healthy donors). Gray dashed line shows the mean for unexpanded T cells. Tissue scores of unexpanded, duplicated, and highly expanded cells were compared by the Kruskal-Wallis test with Dunn’s multiple comparisons correction. Unexpanded versus duplicated and unexpanded versus highly expanded, ****P < 0.0001; duplicated versus highly expanded, **P = 0.0014. (G) Heatmap of differentially expressed genes in highly expanded (>2 clones per clonal group, n = 4 donors, 312 cells) compared with unexpanded (n = 4 donors, 751 cells) CSF CD8 T cells in healthy individuals with a MAST-estimated log fold change over log2(1.1) (10% change) and an FDR of <0.05 (see Materials and Methods and table S4) excluding specific TCR genes. Colored by z-scored values of mean expression for each gene. Pie charts below the graph reflect the cluster and patient composition for each expansion group. (H) Heatmap of differentially expressed genes in highly expanded (>2 clones per clonal group, 344 cells) compared with unexpanded (4883 cells) CSF CD4 T cells in healthy individuals (n = 3 donors) with a MAST-estimated log fold change over log2(1.1) (10% change) and an FDR of <0.05 (see Materials and Methods and table S4) excluding specific TCR genes. Colored by z-scored values of mean expression for each gene. Pie charts below the graph reflect the cluster and patient composition for each expansion group. (I) Line plots of the mean expression and SD of GZMA in CD4 CSF T cells (n = 3 donors) and CCL5 in CD8 CSF T cells (n = 4 donors) in relation to the expansion score. Gray dashed line shows the mean expression for unexpanded cells.