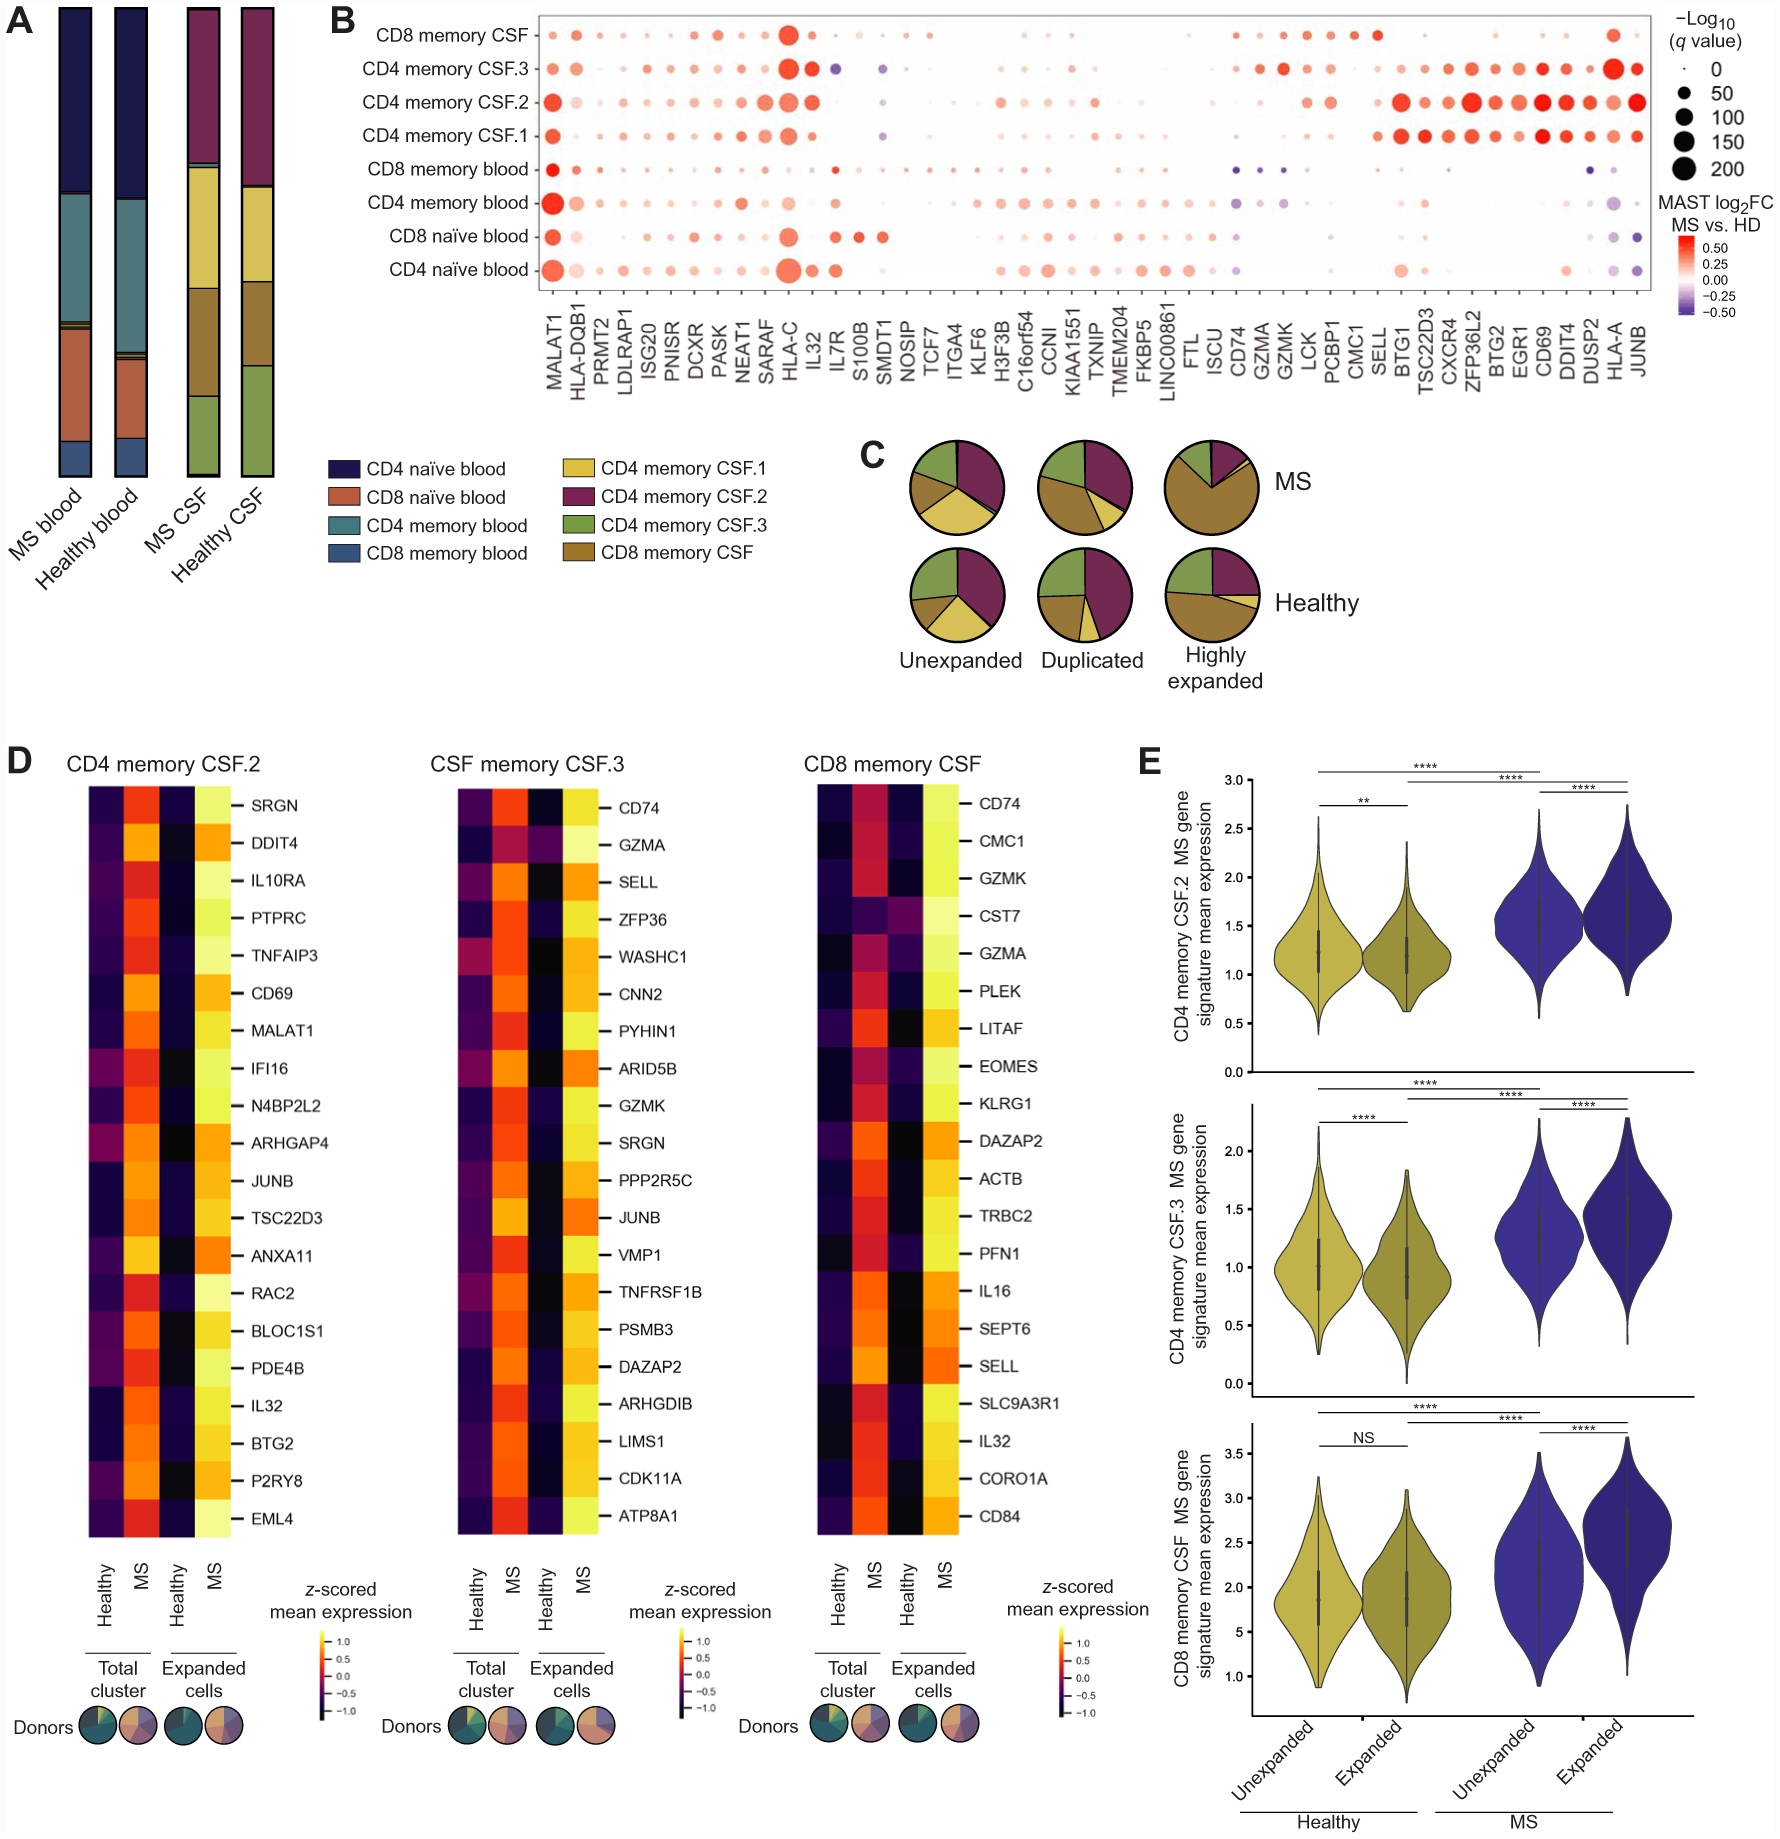
Fig. 5. Examining T cells during neuroinflammation in MS.

(A) T cell composition in the blood (15,482 cells) and CSF (19,252 cells) of patients with MS (n = donors) and healthy donors (Fig. 1). Composition in patients with MS and healthy individuals was compared by multiple t tests with FDR correction (desired FDR = 1%): no significant differences (table S5). (B) Dot plot of the top 10 differentially expressed genes by MAST-estimated log fold change (FC) between cells from patients with MS (n = 5) and healthy controls (n = 6) for each T cell cluster (table S6). Values are shown for all clusters where the gene was significantly differentially expressed (FDR < 0.05). Genes were hierarchically clustered. Dot size relates to −log10(q value), and color relates to MAST-estimated log fold change. (C) Cluster distribution of unexpanded (n = 5 patients with MS, 12,382 CSF T cells), duplicated (n = 5 patients with MS, 1,038 CSF T cells), and highly expanded CSF T cells (n = 5 patients with MS, 1170 CSF T cells) in MS. Compared with distribution in healthy individuals by multiple t tests with FDR correction (desired FDR = 1%): no significant differences (table S5). (D) Heat-maps of the top 20 genes differentially expressed genes between expanded cells in patients with MS (n = 5; CD4 memory CSF.2, 505 cells; CD4 memory CSF.3, 358 cells; CD8 memory CSF, 1207 cells) compared with healthy controls (n = 4; CD4 memory CSF.2, 528 cells; CD4 memory CSF.3, 363 cells; CD8 memory CSF, 496 cells) with the largest increase in MAST-estimated log fold change in expanded cells compared with patients with MS compared with healthy controls in the total cluster (n = 6 healthy donors; n = 5 patients with MS). Genes are ordered in descending order of difference in log fold change between MS versus healthy in expanded cells compared with total cluster. MAST-estimated log2 fold changes for the MS versus healthy donor comparison in expanded cells are all greater than a 15% [log2(1.15)] change. Analysis was performed for the three clusters that contained the majority of clonally expanded CSF T cells. Colored by z-scored values of mean expression for each gene. Pie charts below the graph reflect the patient composition for each expansion group. (E) Violin plots of mean expression for genes in the MS gene signature for each cell in each cluster for unexpanded and expanded CSF T cells in patients with MS (n = 5) and healthy donors (n = 4). Genes included in the gene score were the top 20 genes with the largest increase in MAST-estimated log2 fold change between patients with MS versus healthy individuals in expanded CSF T cells compared with the total cluster shown in Fig. 6D (fig. S5). Comparisons within each cluster were made by the Kruskal-Wallis test with Dunn’s multiple comparisons correction. **P = 0.0065, ****P < 0.0001, and NS = P > 0.9999.
