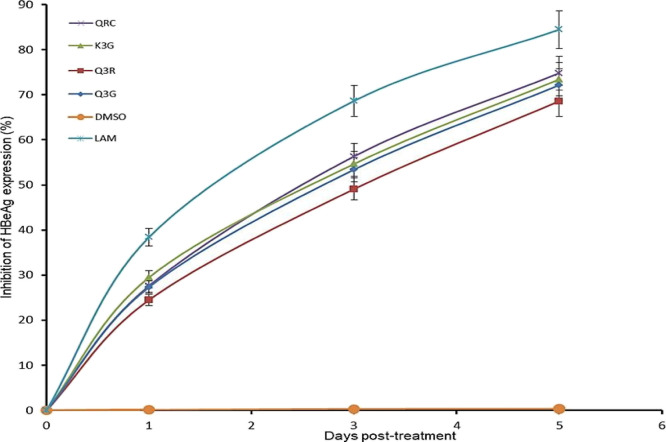
Figure 2.
Time course inhibition of HBeAg expressions by E. schimperi-derived Q3G, Q3R, and K3G (27 μM, each) relative to untreated control in HepG2.2.15 culture supernatants at days 1, 3, and 5 post-treatment. QRC (27 μM) and LAM (2 μM) served as positive controls while DMSO (0.1%) acted as the negative control. The values on the Y-axis are means of three determinations.

