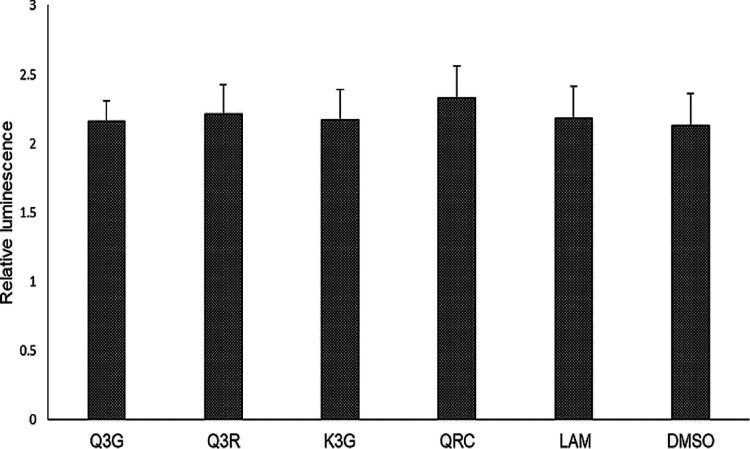
Figure 3.
Reporter gene assay showing relative expressions of luciferase in transfected HepG2.2.15 cells treated with Q3G, Q3R, and K3G (27 μM, each). QRC (27 μM) and LAM (2 μM) served as positive controls, while DMSO (0.1%) acted as the negative control. The values on the Y-axis are means of three determinations.

