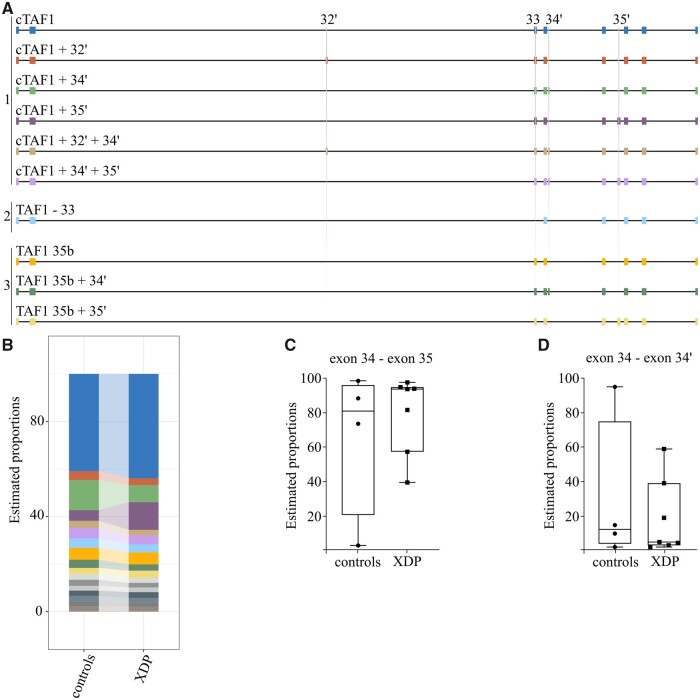
Figure 3.
The exonic structure of TAF1 mRNA is preserved in XDP brains. The structure of the 10 most abundant TAF1 isoforms detected using long-read sequencing is depicted in panel A. Three different TAF1 scaffolds are indicated: 1 = canonical TAF1, including all canonical exons; 2 = skipping of exon 33, including all canonical exons but exon 33; 3=35b, in which all canonical TAF1 exons are present but exon 35 is substituted by 35b. The DTU estimating isoform proportion in the PFC of XDP versus controls is shown as percentage of the total mapped reads in panel B. The color-coding is adherent with the composition of the 10 most abundant isoforms depicted in panel A. The remaining isoforms are represented in grey scale. No significant difference was observed when comparing 34′-containing TAF1 mRNAs between XDP patients and controls (drimseq test, p-value = 0.991). Panels C and D represent single data points for the percentage of isoform excluding (panel C, exon34—exon35) or including (panel D, exon 34—exon 34’) microexon 34′ for each control or XDP sample.

