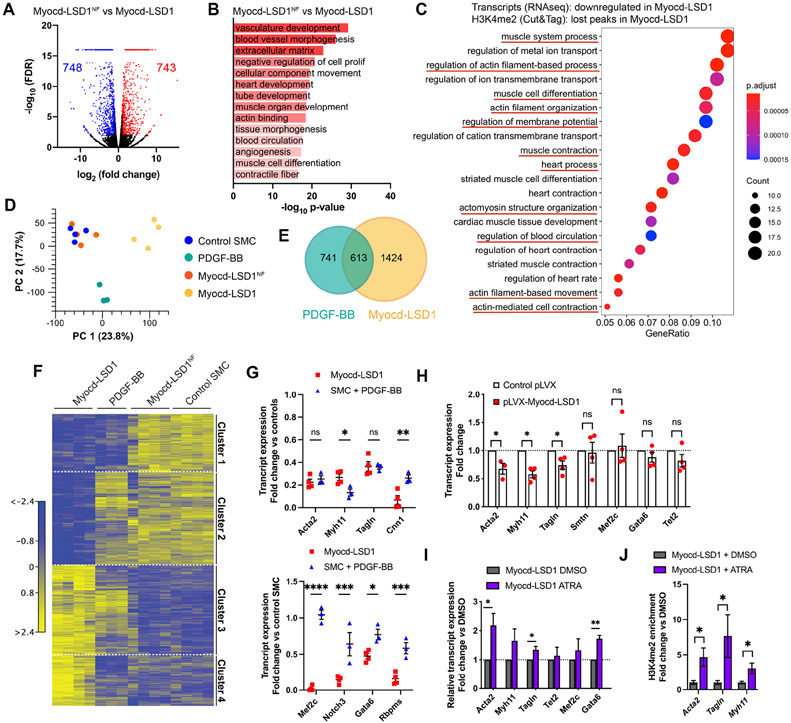
Figure 5: H3K4me2 editing is associated with a profound loss of SMC lineage identity.
Bulk RNAseq performed on control, Myocd-LSD1, Myocd-LSD1NF, and PDGF-BB-treated SMC. A. Volcano plot representing genes differentially expressed in Myocd-LSD1 vs. Myocd-LSD1NF SMC. B. GO Pathway analysis showing the most significantly downregulated pathways in Myocd-LSD1 vs. Myocd-LSD1NF SMC. C. GO pathway analysis on intersected gene sets with transcript downregulation and H3K4me2 loss in Myocd-LSD1 SMC vs Myocd-LSD1NF SMC. D. Principal component analysis. E. Venn diagram representing the overlap between differentially expressed genes in Myocd-LSD1 and PDGF-BB treated SMC. F. Heat map of differential transcript expression in Myocd-LSD1, PDGF-BB treated, Myocd-LSD1NF, and control SMC. G. Expression levels of SMC contractile genes (cluster 1, top graphs) and SMC master differentiation regulators (cluster 2, bottom graphs) in Myocd-LSD1 and PDGF-BB treated SMC. Expression normalized to the expression in pooled control and Myocd-LSD1NF SMC. H. Normalized transcript expression in control SMC transiently transfected with Myocd-LSD1 or control plasmid. I. Transcript expression in Myocd-LSD1 SMC treated with vehicle or all-trans retinoic acid (ATRA). J. ChIP-qPCR of H3K4me2 on CArG box region of Acta2, Tagln and Myh11 in Myocd-LSD1 SMC treated with vehicle or ATRA. Data are represented as mean ± s.e.m of 3-4 independent biological replicates. Groups were compared by multiple Student t-test. * p<0.05, ** p<0.001, *** p<0.0001.

