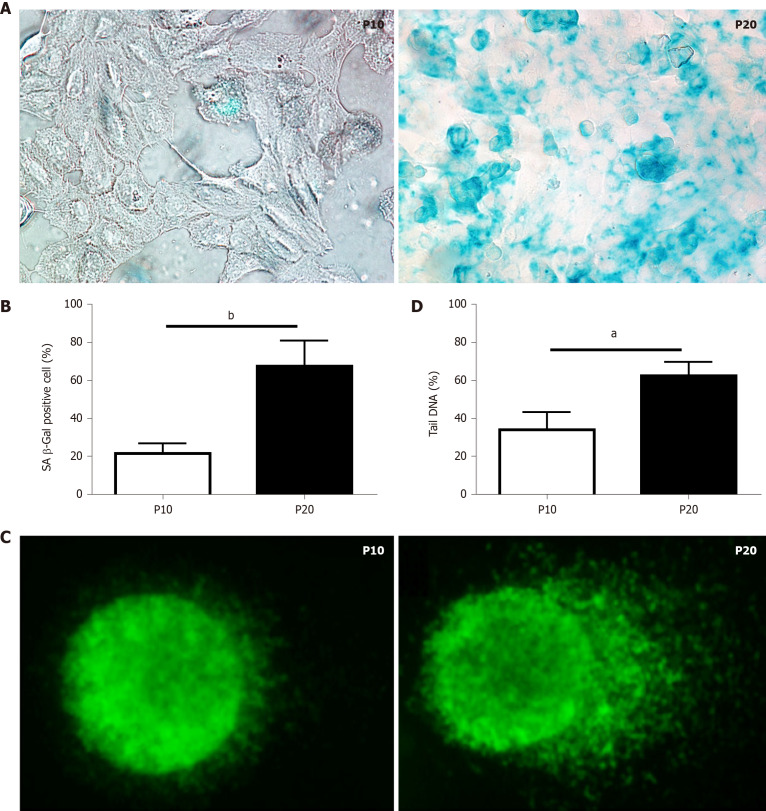
Figure 1.
Characterization of markers of cellular senescence in HepaRG cells. A: Senescence-associated β-galactosidase staining of HepaRG cells at passage 10 (P10) or P20. After staining, the cells were imaged by phase contrast microscopy. Micrographs are shown at magnification 200 ×; B: Quantitative analysis of positive β-galactosidase-stained cells in P10 and P20 HepaRG cells; C: Representative images of DNA damage analysis by the comet assay in P10 and P20 HepaRG cells. After staining, the cells were imaged by fluorescence microscopy. Micrographs are shown at magnification 600 ×; D: Quantitative analysis of DNA tails from 100 cells. Data in the graphs are represented as the mean ± SD of three independent experiments. Statistical differences were assessed by the Student’s t-test. aP < 0.05 vs P10; bP < 0.01 vs P10.

