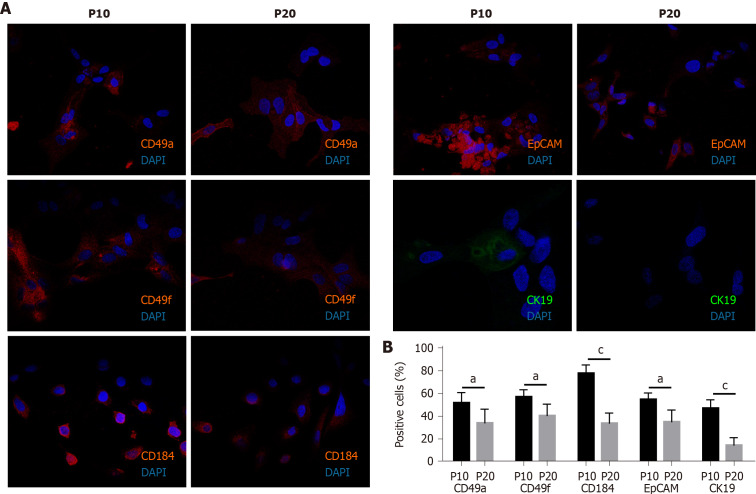
Figure 2.
Expression of progenitor markers in HepaRG cells after the transdifferentiation process. A: Representative immunofluorescence images of HepaRG cells at passage 10 (P10) or P20. After staining, the cells were imaged by confocal microscopy. Micrographs are shown at magnification 200 ×; B: Quantitative analysis of positively stained cells in P10 and P20 HepaRG cells. Data in the graphs are represented as the mean ± standard deviation of three independent experiments. Statistical differences were assessed by the Student’s t-test. aP < 0.05 vs P10; cP < 0.001 vs P10.

