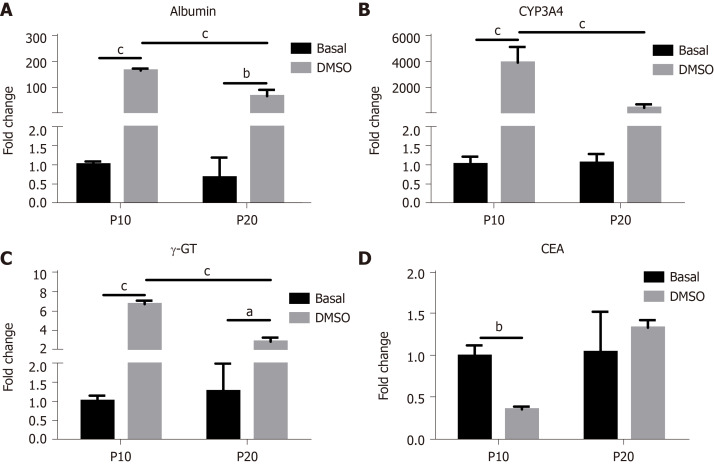
Figure 4.
Gene expression analysis in HepaRG cells at passage 10 or passage 20 in basal conditions or after the transdifferentiation protocol (dimethyl sulfoxide). A: mRNA level of albumin; B: Cytochrome P350 3A4 (CYP3A4); C: Gamma-glutamyl transpeptidase (γ-GT); D: Carcinoembryonic antigen (CEA) measured by reverse transcription-polymerase chain reaction. Data in the graphs are represented as the mean ± standard deviation of three independent experiments. Statistical differences were assessed by two-way analysis of variance followed by the Tukey test as the post hoc test. aP < 0.05; bP < 0.01; cP < 0.001. P10: Passage 10; P20: Passage 20; DMSO: Dimethyl sulfoxide.

