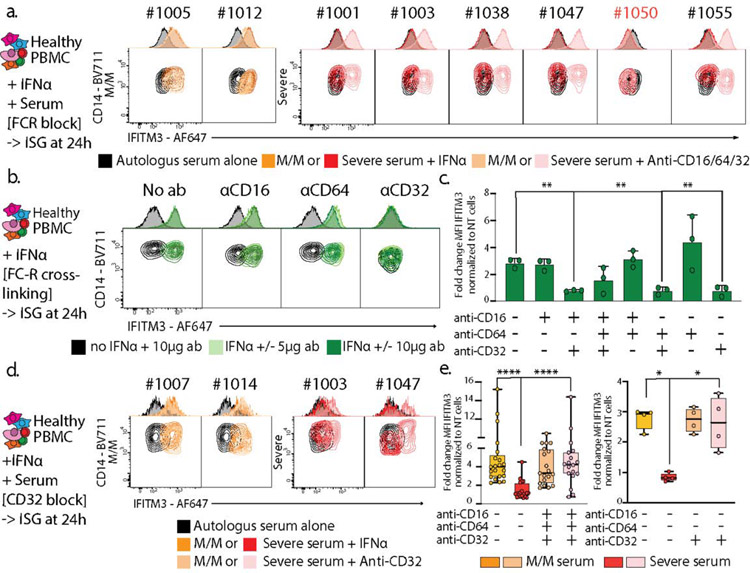
Figure 4: IgG-mediated neutralization of ISG induction by Severe COVID-19 Patients sera occurs through binding of their Fc to CD32.
a. Contour plots and histograms of CD14 and IFITM3 expression by monocytes from healthy PBMC cultured with IFNα and serum from either heathy donor, mild/moderate or severe SARS-CoV-2 positive patient, in the presence or not of anti-CD16/CD32/CD64 antibodies to block Fc receptors. b and c. CD14/IFITM3 contour plot and histograms (b) and boxplots presenting fold changes of IFITM3 expression (c) on CD14 monocytes after culturing healthy PBMCs +/− IFNα (1 pg/μl) +/− 5 or 10 μg/ml of plate-coated isotype control, anti-CD16, anti-CD32 or anti-CD64 antibodies alone or in combination to cross-link and activate Fc receptors. Panel c presents the results of 2 independent experiments and 2 different cell donors, including two antibody quantities for one of the donors (n=3 experiments). Data is plotted as mean±SD. d. Neutralization assay as presented in panel a, with the sole addition of anti-CD32 blocking antibodies. e. Boxplots showing fold changes of IFITM3 expression for experiments presented in panel a (left graph, 5 independent experiments on 3 different cell donors) and panel d (right graph, 1 experiment on 2 different cell donors). Differences in c and e were calculated using a two-way ANOVA test with multiple comparisons. * p.value < 0.05; ** p.value < 0.01; **** p.value < 0.0001. Boxplot center, median; box limits, 25th and 75th percentile; whiskers, min. and max. data point. * p.value < 0.05; ** p.value < 0.01; *** p.value <0.001; **** p.value < 0.0001.

