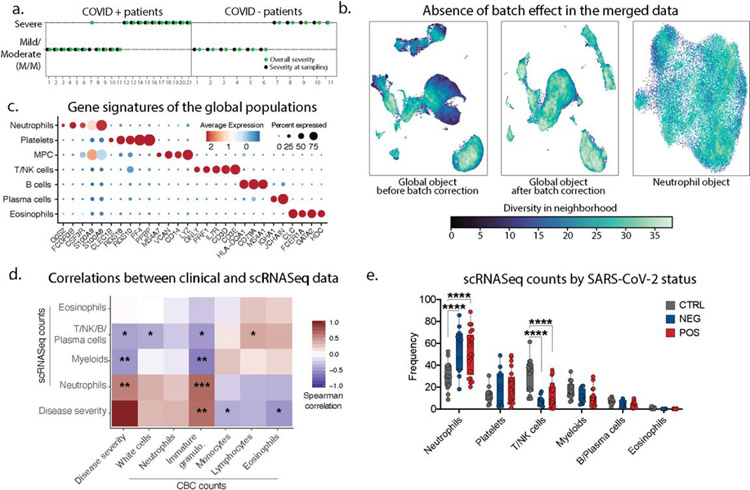
Extended Data 1: Immune phenotyping of patients admitted with respiratory symptoms using whole blood single-cell RNA sequencing.
a. Patient symptoms plot: symptom at day of sampling (first day of admission to the hospital) is represented in black, while symptom based on the entire course of hospitalization is in green. In the rest of the manuscript, we categorized patient into mild/moderate or severe cases based on all the entire course of hospitalization (green). b. Quantification of the batch effect using neighbor diversity score in the global object UMAP before (left) and after (middle) batch correction, along with the neutrophil (right) UMAP plot, as in Fig1b and Fig1c, using the diversity in neighborhood method. c. Dotplot representation of landmark genes expressed by global populations in Fig1b. d. Spearman’s correlation comparison between disease severity and population frequencies calculated from 10X scRNAseq analyses (10X) or complete blood cell counts (CBC). Patients for which CBC counts were unavailable were excluded. Significance was calculated using Spearman’s method. * p value<0.05; ** p value <0.05; *** p value<0.005 (n=29) e. Frequency of the global populations in Fig1b among all cells across SARS-CoV-2 status (control, n=14; NEG, n=11; POS, n=21).

