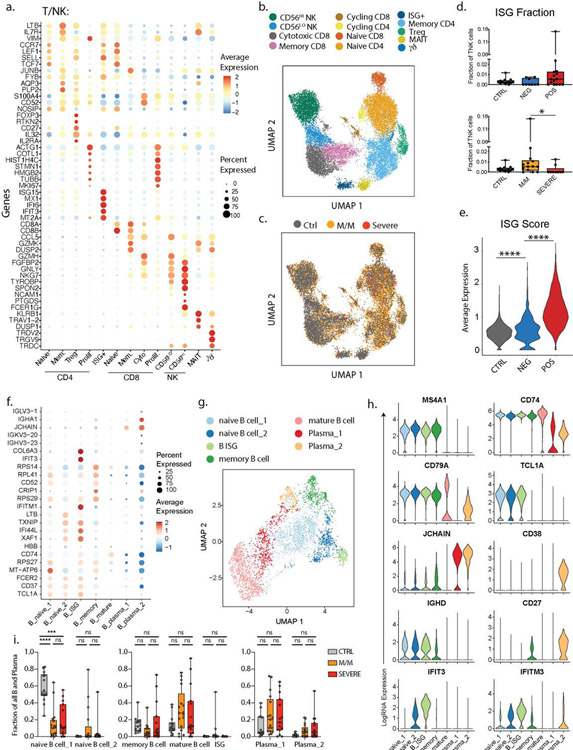
Extended Data 5: Characterization of the peripheral blood T and B lymphocytes subsets in our cohort.
a. Dotplot representation of the top DEG between clusters identified in the T and NK cell subset. b. UMAP visualization of 16,708 T and NK cells in the entire dataset showing various subsets, colored distinctly by their identity. c. Overlay of the above UMAP of all T and NK cells, colored by disease severity underlining the lack of batch effects while merging the datasets from all patients. d. Abundance of the Interferon-stimulated-gene (ISG)+ subset among all T and NK cells in healthy donors (n=13), SARS-CoV-2 negative (n=9) and SARS-CoV-2 positive (n=15) patients (top) and in healthy donors and patients with mild/moderate (M/M, n=14) and severe disease (bottom, n=9). e. ISG signature score between healthy controls, SARS-CoV-2 negative and SARS-CoV-2 positive patients. f. Dotplot representation of the top DEG between clusters identified in the B and plasma cell subset. g. UMAP visualization of 4,380 B and plasma cells isolated from the entire dataset showing various subsets, colored distinctly by their identity. h. Violin plots of canonical genes previously described as expressed by B and plasma cells for each identified cluster. i. Frequencies of the identified clusters among all B and plasma cells in healthy donors (n=14) and patients with M/M (n=17) and severe disease (n=15). Differences in d. and e. were calculated using Kruskal-Wallis test. * p <0.05 and **** p< 0.001. Differences in i. were calculated using a two-way ANOVA test with multiple comparisons. * p.value < 0.05 and **** p.value < 0.0001. ns, non-significant. Boxplot center, median; box limits, 25th and 75th percentile; whiskers, min. and max. data point.

