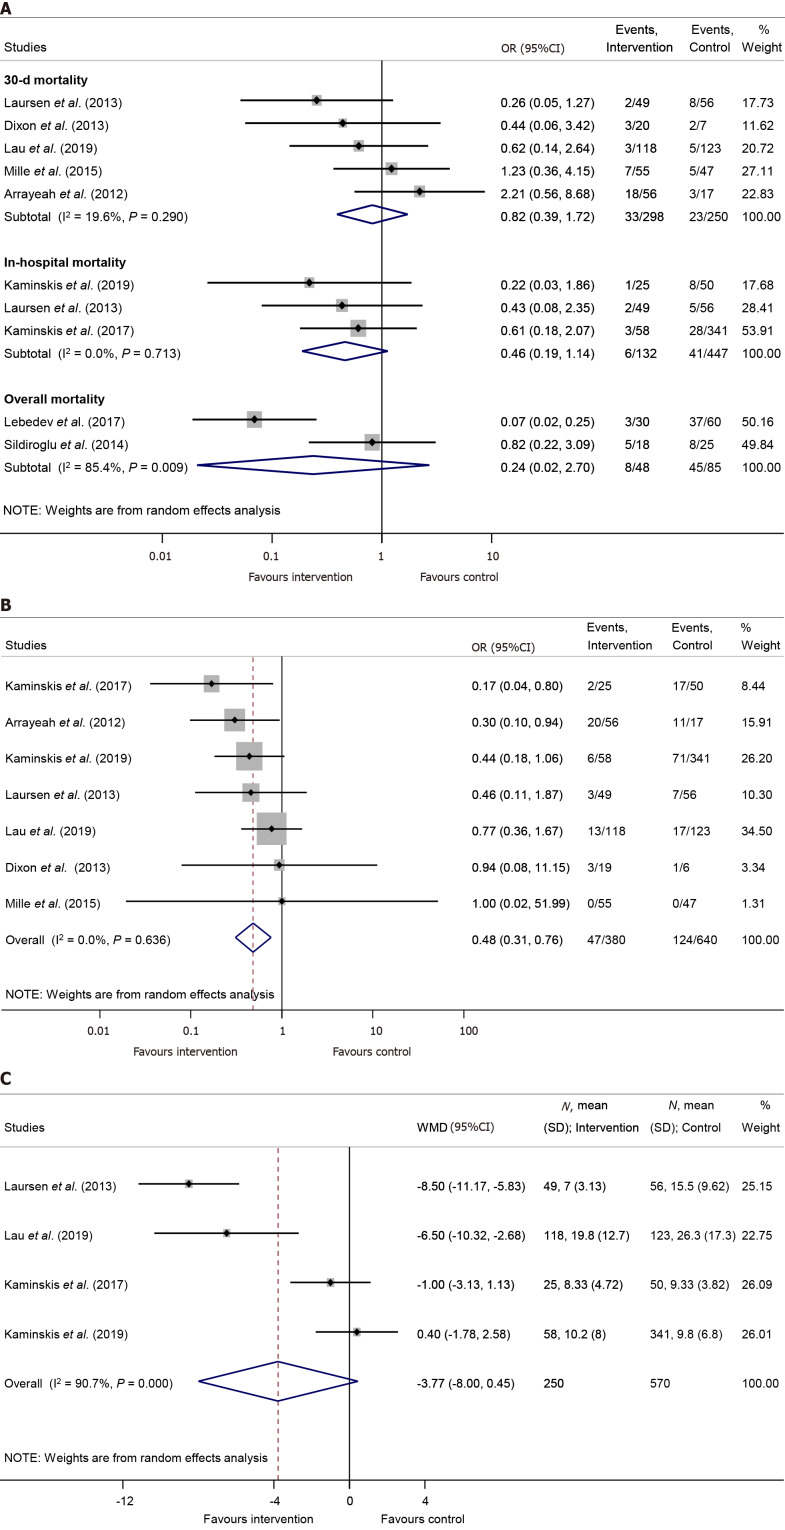
Figure 3.
Forest plot of studies. A: Representing no significant difference in mortality rates between the prophylactic transcatheter arterial embolization and the control group; B: Representing significantly lower odds of reintervention in the prophylactic transcatheter arterial embolization than the control group; C: representing no significant difference in length of hospital stay in days between the prophylactic transcatheter arterial embolization and the control group. OR: Odds ratio; 95%CI: Confidence interval; WMD: Weighted mean difference; SD: Standard deviation.

