. 2021 Jun 2;11(10):2620–2637. doi: 10.1158/2159-8290.CD-20-1219

Figure 1.

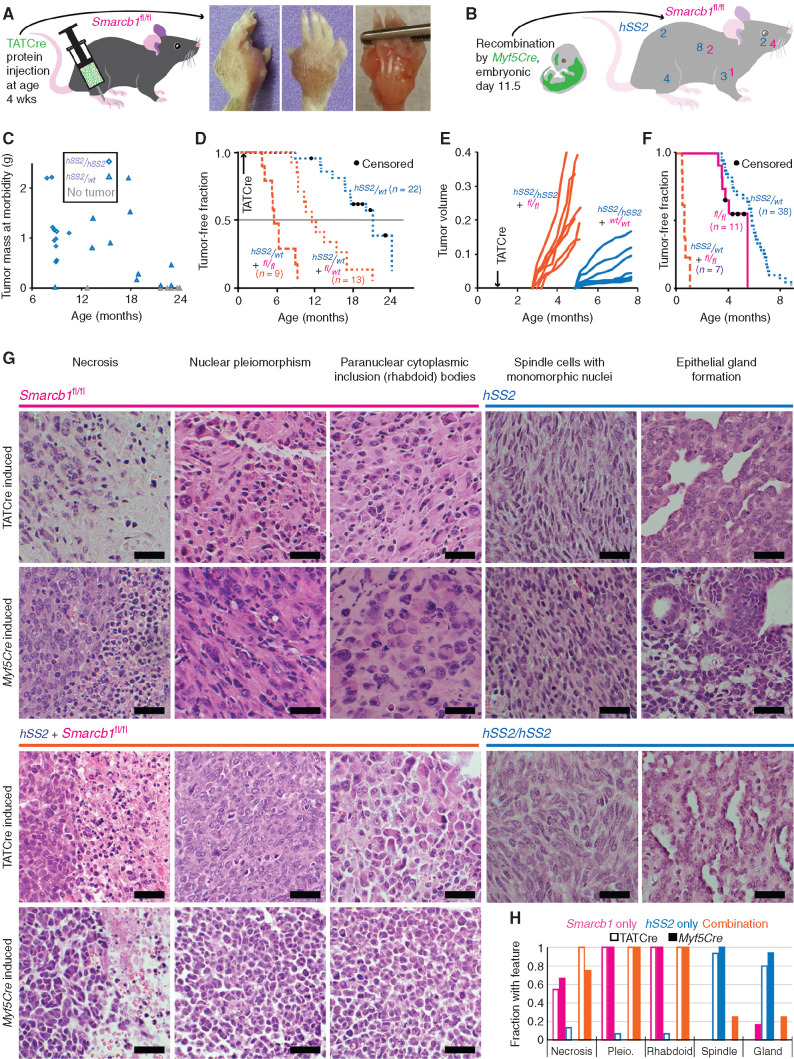
Figure 1. SS18–SSX and Smarcb1 compete in the balance between sarcomagenesis and tumor suppression, driving different phenotypes. A, Schematic for TATCre protein injection into the paw and gross images of a tumor that developed over a year later in a Smarcb1fl/fl mouse. B, Schematic of the expression and recombination pattern from Myf5Cre and a mouse with anatomic distribution of Myf5Cre; Smarcb1fl/fl and Myf5Cre;hSS2 tumors from 16 consecutive mice in each group (two-tailed Fisher exact test for incidence of tumors in each cohort, P = 0.0002; χ2 = 17.03 with four degrees of freedom and P = 0.0019 for comparing distributions of tumors in each cohort). C, Distribution of tumor size versus time at morbidity among cohorts of hSS2/wt and hSS2/hSS2 mice in which sarcomagenesis was initiated at age 4 weeks by hind-limb injection of TATCre (two-tailed t test, P = 6.6 × 10⁻⁵ for time to tumorigenesis). D, Kaplan–Meier (KM) plot of the tumor-free fraction among cohorts of hSS2-heterozygous mice bearing each possible Smarcb1-floxed genotype (in magenta) after TATCre injection into the hind limb at age 4 weeks. (The cohort of hSS2-het–alone is data from the cohort depicted in Fig. 2A for reference; the other two cohorts are littermate-controlled cohorts: Smarcb1fl/wt compared with Smarcb1fl/fl, log-rank test z = 4.43, P < 0.001.) E, Tumor growth by caliper measurements in littermate cohorts of mice homozygous for hSS2 and either wild-type or Smarcb1fl/fl genotype following TATCre injection at age 4 weeks (two-tailed t test, P = 1.3 × 10⁻⁸ for time to detectable tumor). F, KM plot of Myf5Cre-induced combination genotype tumors compared with either hSS2 or Smarcb1fl/fl alone (log-rank tests comparing combination genotype to Smarcb1fl/fl alone, z = 4.62, P < 0.0001; to hSS2 alone, z = 8.15, P < 0.0001). G, Representative hematoxylin and eosin photomicrographs of tumors from Smarcb1fl/fl, hSS2 heterozygous, combination hSS2 and Smarcb1fl/fl, and hSS2 homozygous mice activated by TATCre limb injection or Myf5Cre (scale bars = 20 μm). H, Graph of the fraction of tumors by each induction method demonstrating each of the histologic features (TATCre + Smarcb1fl/fl, n = 11; Myf5Cre;Smarcb1fl/fl, n = 8; TATCre + hSS2, n = 15; Myf5Cre;hSS2, n = 17; TATCre + hSS2;Smarcb1fl/fl, n = 13; Myf5Cre;hSS2;Smarcb1fl/fl, n = 8). Pleio., pleiomorphism.

SS18–SSX and Smarcb1 compete in the balance between sarcomagenesis and tumor suppression, driving different phenotypes. A, Schematic for TATCre protein injection into the paw and gross images of a tumor that developed over a year later in a Smarcb1fl/fl mouse. B, Schematic of the expression and recombination pattern from Myf5Cre and a mouse with anatomic distribution of Myf5Cre; Smarcb1fl/fl and Myf5Cre;hSS2 tumors from 16 consecutive mice in each group (two-tailed Fisher exact test for incidence of tumors in each cohort, P = 0.0002; χ2 = 17.03 with four degrees of freedom and P = 0.0019 for comparing distributions of tumors in each cohort). C, Distribution of tumor size versus time at morbidity among cohorts of hSS2/wt and hSS2/hSS2 mice in which sarcomagenesis was initiated at age 4 weeks by hind-limb injection of TATCre (two-tailed t test, P = 6.6 × 10⁻⁵ for time to tumorigenesis). D, Kaplan–Meier (KM) plot of the tumor-free fraction among cohorts of hSS2-heterozygous mice bearing each possible Smarcb1-floxed genotype (in magenta) after TATCre injection into the hind limb at age 4 weeks. (The cohort of hSS2-het–alone is data from the cohort depicted in Fig. 2A for reference; the other two cohorts are littermate-controlled cohorts: Smarcb1fl/wt compared with Smarcb1fl/fl, log-rank test z = 4.43, P < 0.001.) E, Tumor growth by caliper measurements in littermate cohorts of mice homozygous for hSS2 and either wild-type or Smarcb1fl/fl genotype following TATCre injection at age 4 weeks (two-tailed t test, P = 1.3 × 10⁻⁸ for time to detectable tumor). F, KM plot of Myf5Cre-induced combination genotype tumors compared with either hSS2 or Smarcb1fl/fl alone (log-rank tests comparing combination genotype to Smarcb1fl/fl alone, z = 4.62, P < 0.0001; to hSS2 alone, z = 8.15, P < 0.0001). G, Representative hematoxylin and eosin photomicrographs of tumors from Smarcb1fl/fl, hSS2 heterozygous, combination hSS2 and Smarcb1fl/fl, and hSS2 homozygous mice activated by TATCre limb injection or Myf5Cre (scale bars = 20 μm). H, Graph of the fraction of tumors by each induction method demonstrating each of the histologic features (TATCre + Smarcb1fl/fl, n = 11; Myf5Cre;Smarcb1fl/fl, n = 8; TATCre + hSS2, n = 15; Myf5Cre;hSS2, n = 17; TATCre + hSS2;Smarcb1fl/fl, n = 13; Myf5Cre;hSS2;Smarcb1fl/fl, n = 8). Pleio., pleiomorphism.