. 2021 Jun 2;11(10):2620–2637. doi: 10.1158/2159-8290.CD-20-1219

Figure 4.

Figure 4. SMARCB1 at reduced protein levels in synovial sarcoma cells resides in BAF complexes. A, WBs for reciprocal IP in human synovial sarcoma cell line HSSYII and control HEK293T cells, for PBAF components SMARCB1, and PBRM1. B, WBs for reciprocal IP in human cells for CBAF components DPF2 and SMARCB1. C, WBs for BAF-family components in glycerol gradients for human synovial sarcoma cell lines HSSYII and ASKA, as well as control HEK293T cells. D, WBs for reciprocal IP in fusion-only and combination genotype mouse tumors for PBAF components SMARCB1 and PBRM1. E, WBs for CBAF component IP in fusion-only and control (EA1 = EWSR1–ATF1-induced mouse tumor) tumors. F, Optical densitometry–quantified gradients of SMARCB1 and PBRM1 depict overlap among the glycerol gradient fractions in two human synovial sarcoma cell lines and a mouse synovial sarcoma tumor. G, Quantified fraction densities of each protein compared with the mean density of PBAF core fractions 19 and 20 of itself (two-tailed t test P values listed at top; the three sample sources are HSSYII, ASKA, and mouse synovial sarcoma tumor gradients). ns, not significant. H, WBs for BAF-family components after application of scrambled versus SMARCB1-targeting siRNA (siSCR and siSMARCB1). I, Optical densitometry–quantified gradients of SMARCC1 demonstrate shifts in the relative abundance of PBAF-sized complexes with added disruption of SMARCB1 in the ASKA cell line or mouse tumors.

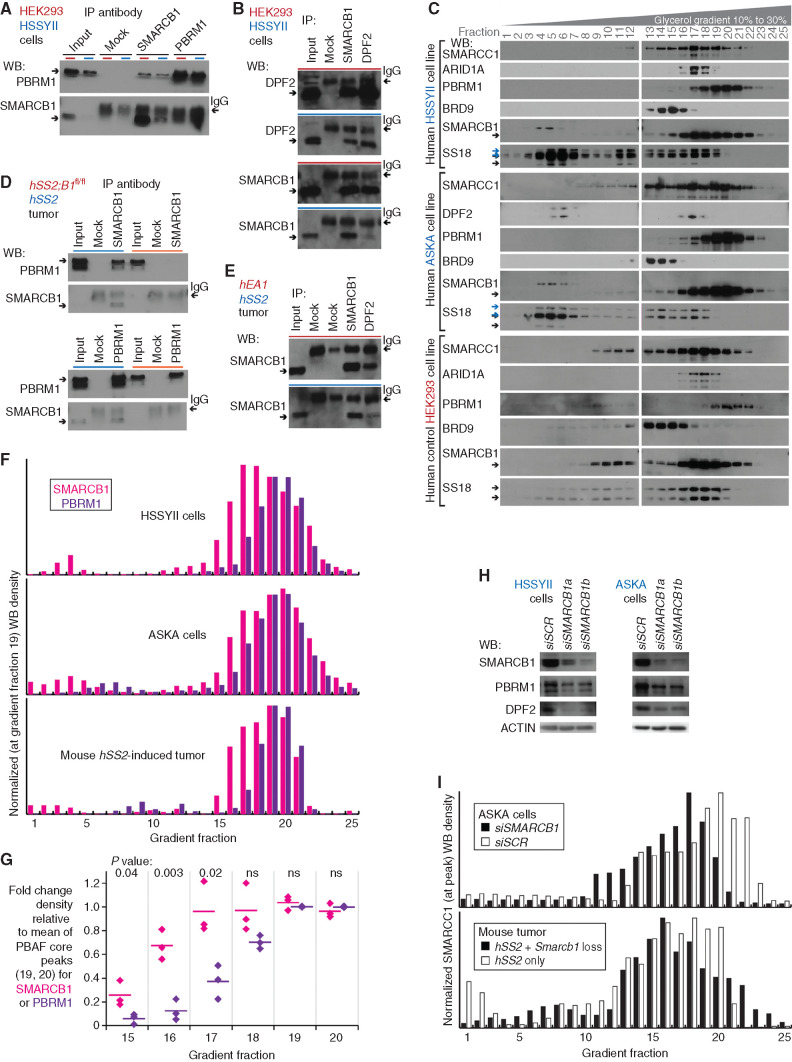
SMARCB1 at reduced protein levels in synovial sarcoma cells resides in BAF complexes. A, WBs for reciprocal IP in human synovial sarcoma cell line HSSYII and control HEK293T cells, for PBAF components SMARCB1, and PBRM1. B, WBs for reciprocal IP in human cells for CBAF components DPF2 and SMARCB1. C, WBs for BAF-family components in glycerol gradients for human synovial sarcoma cell lines HSSYII and ASKA, as well as control HEK293T cells. D, WBs for reciprocal IP in fusion-only and combination genotype mouse tumors for PBAF components SMARCB1 and PBRM1. E, WBs for CBAF component IP in fusion-only and control (EA1 = EWSR1–ATF1-induced mouse tumor) tumors. F, Optical densitometry–quantified gradients of SMARCB1 and PBRM1 depict overlap among the glycerol gradient fractions in two human synovial sarcoma cell lines and a mouse synovial sarcoma tumor. G, Quantified fraction densities of each protein compared with the mean density of PBAF core fractions 19 and 20 of itself (two-tailed t test P values listed at top; the three sample sources are HSSYII, ASKA, and mouse synovial sarcoma tumor gradients). ns, not significant. H, WBs for BAF-family components after application of scrambled versus SMARCB1-targeting siRNA (siSCR and siSMARCB1). I, Optical densitometry–quantified gradients of SMARCC1 demonstrate shifts in the relative abundance of PBAF-sized complexes with added disruption of SMARCB1 in the ASKA cell line or mouse tumors.