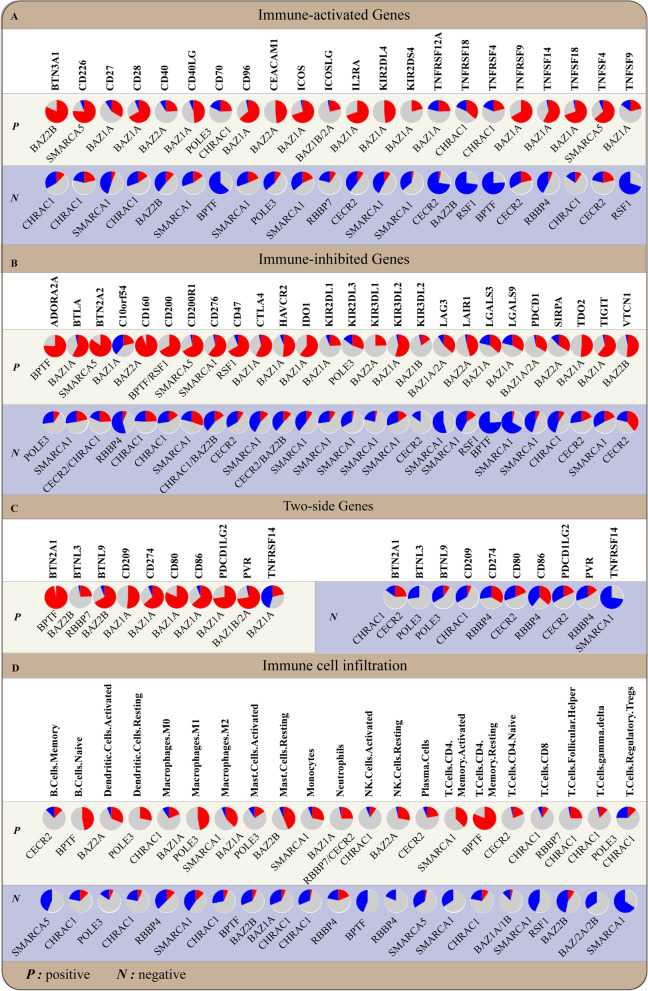
Fig. 7.
The mRNA expression levels of ISWI members correlate with immune checkpoint gene levels and immune cell infiltration. The most significant correlation between ISWI members and immune checkpoints at the gene level or between the gene level of ISWI and immune cell infiltration in the 33 tumors from TCGA database are shown in the pie chart. Spearman’s method was used to calculate the correlation between ISWI family members and immune checkpoints (A-C) or immune cell infiltration (D) in 33 tumors. The CIBERSORT algorithm was used to calculate the proportion of different types of cells. Red indicates a positive correlation, blue indicates a negative correlation, and gray indicates no significant correlation. Cancer is abbreviated as follows: Esophageal carcinoma (ESCA), Liver hepatocellular carcinoma (LIHC), Rectum adenocarcinoma (READ), Colon adenocarcinoma (COAD), Lung adenocarcinoma (LUAD), Stomach adenocarcinoma (STAD), Head and Neck squamous cell carcinoma (HNSC), Bladder Urothelial Carcinoma (BLCA), Breast invasive carcinoma (BRCA), Lung squamous cell carcinoma (LUSC), Uterine Corpus Endometrial Carcinoma (UCEC), Kidney renal clear cell carcinoma (KIRC), Thyroid carcinoma (THCA), Kidney Chromophobe (KICH), Kidney renal papillary cell carcinoma (KIRP), Prostate adenocarcinoma (PRAD)

