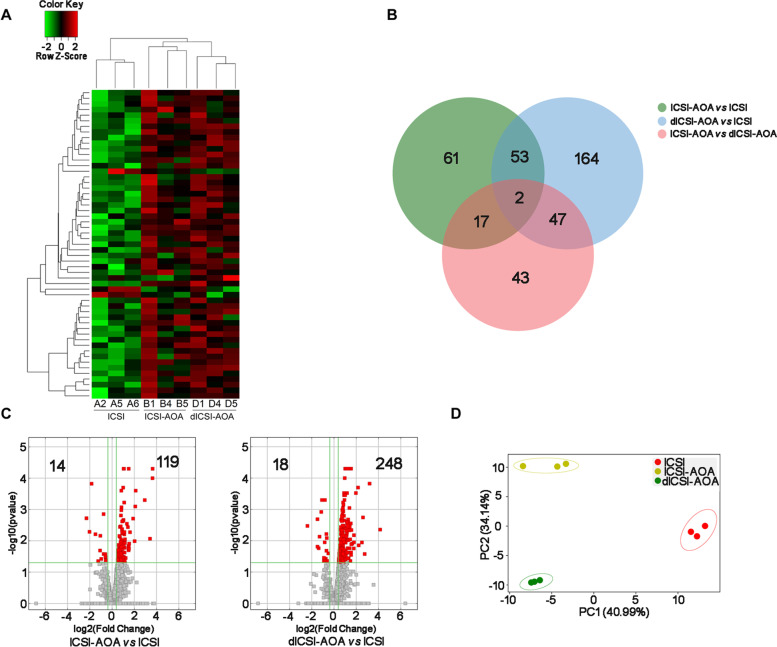
Fig. 3.
The mRNA expression analysis in blastocysts obtained in ICSI group, ICSI-AOA group and dICSI-AOA group. A Heatmap of global gene expression. Letters and numbers denote ID of a specific embryo. B Venn diagram with differentially expressed genes (DEGs) for pair-wise comparisons (ICSI-AOA vs. ICSI, dICSI-AOA vs. ICSI, ICSI-AOA vs. dICSI-AOA). C Volcano plot defined up-regulated/down-regulated mRNAs for pair-wise comparisons (ICSI-AOA vs. ICSI, dICSI-AOA vs. ICSI). D Principal Component Analysis (PCA) of the RNA-Seq samples: ICSI (red), ICSI-AOA (yellow) and dICSI-AOA (green)

