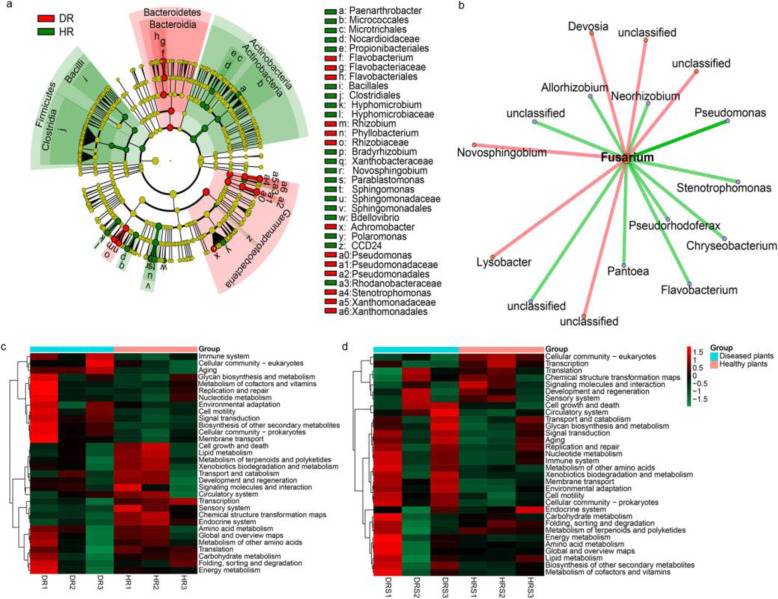
Fig. 5.
Taxonomic and functional characteristics of bacterial communities after pathogen infection. Least discriminant analysis (LDA) effect size taxonomic cladogram comparing bacteria from healthy and diseased samples. The different classification levels are presented from the inside to the outside. The red nodes indicate enriched genera in diseased roots, yellow nodes indicate no difference, and green nodes indicate enriched genera in healthy roots. HR, healthy roots; DR, diseased roots. b The relationship between root-associated bacteria (relative abundance > 0.001) and Fusarium was calculated using Spearman correlations. Bacteria with a correlation coefficient greater than 0.6 were used to construct the network. Red and green lines indicate that the relative abundance of the bacteria was positively or negatively correlated with Fusarium. c The root and d rhizosphere functional profiles. The color scale represents enrichment or reduction of the predicted function

