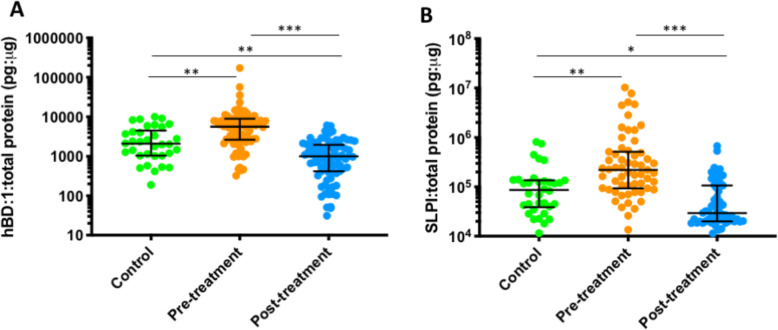
Fig. 5.
Levels of hBD-1 (A) and SLPI levels (B) for 80 treated and 34 untreated healthy controls. Levels prior to treatment were significantly higher than the controls (hBD-1 p = 0.0033, SLPI p = 0.0006, unpaired t test) (analysis 1). Excisional treatment led to a significant reduction of levels for both hBD-1 and SLPI when assessed in paired samples (hBD-1 p < 0,0001, SLPI p < 0.0001, paired t test) (analysis 2). The levels post-treatment were significantly lower than those of controls (hBD-1 p < 0.0029, SLPI p = 0.0382, unpaired t test) (analysis 3). Dots depict individual samples; error bars denote median and interquartile ranges, ***p < 0.001; **p < 0.01; *p < 0.05

