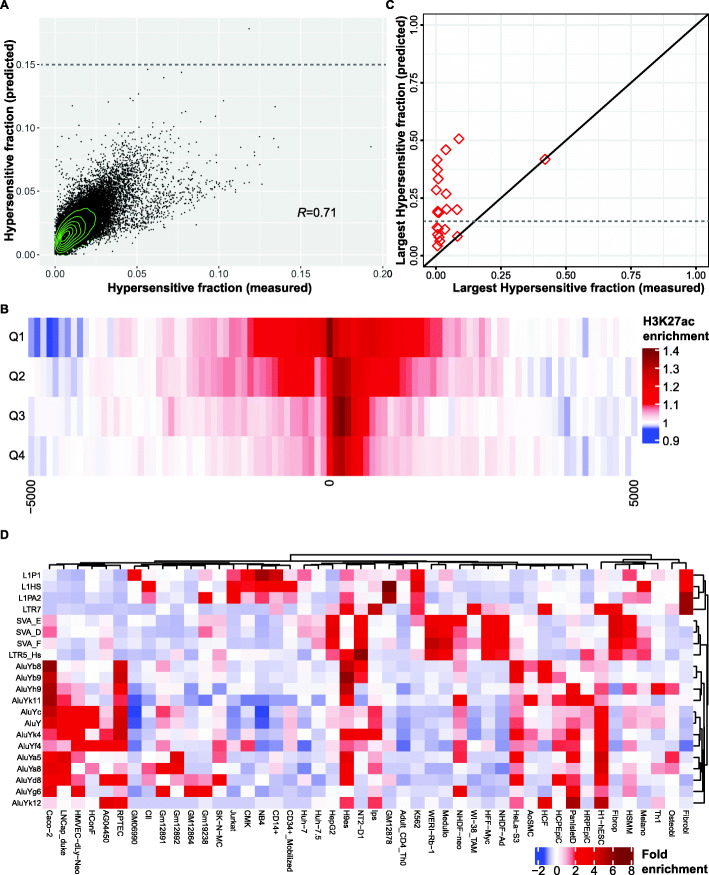
Fig. 4.
A Scatter-plot of measured vs. predicted hypersensitive fraction for 224 ancient TE subfamilies across 125 cell lines (28,000 points), with Pearson correlation. Dashed line: predicted fraction = 0.15. B Heatmap of average H3K27ac enrichment relative to flanking regions in H9 embryonic stem cells at LTR TEs genome-wide, stratified by predicted DNaseI hypersensitivity quartile. C) Scatter-plot of the largest hypersensitive fraction across 125 cell lines for each of the 20 RMSs: measured vs. predicted. Dashed line: predicted fraction = 0.15. D Heatmap of fold enrichment of predicted hypersensitive fraction for 20 RMSs plus LTR7. Only cell lines for which at least one of the 22 TE subfamilies has two-fold enrichment are shown

