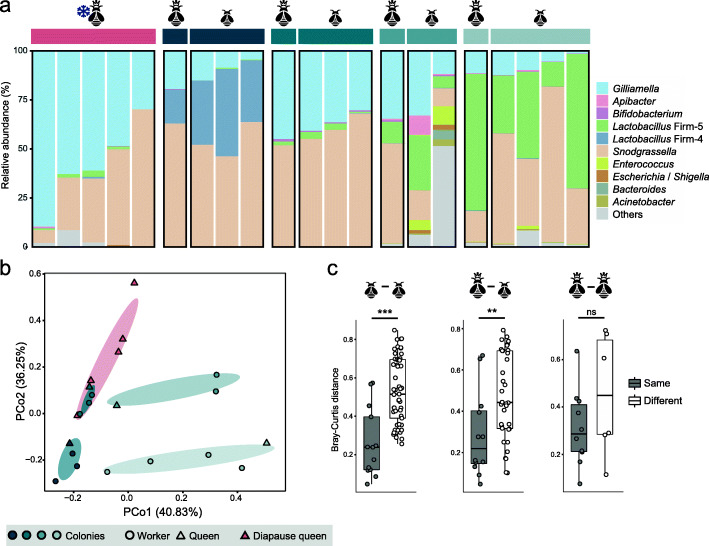
Fig. 3.
Gut microbiota compositions of the queen and worker bumblebees during hibernation and early stage of nest establishment. (a) Relative phylotype-level abundance profiles for the queen and newly emerged worker samples. Queen-worker paired samples were simultaneously collected from four independent nests. (b) PCoA plot based on the Bray-Curtis distance between samples highlights the spatial clustering of samples concerning the queen-worker pairs. (c) Gut compositions are more similar for bees from the same nest as shown by Bray-Curtis dissimilarity of individual workers (left), queen-worker pairs (center), and queens (right). ***p < 0.001; **p < 0.01; ns, not significant (Wilcoxon test)

