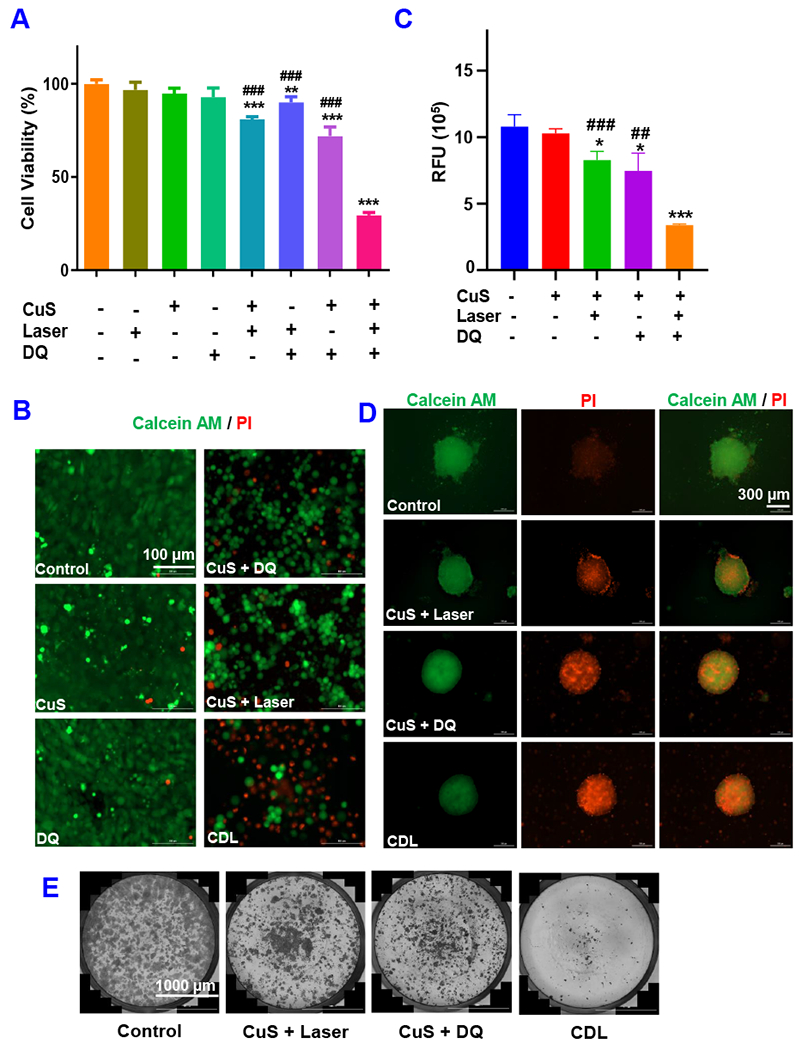
Figure 3. In Vitro Antitumor Effects.

(A) the MTT assay and (B) Calcein-AM/PI straining. The 4T1 tumor spheroid viability was determined with (C) CellTiter-Blue assay and (D) Calcein-AM/PI straining. (E) Cell colony formation assay. (CuS, 0.1 mM; DQ, 2 μM Laser, 2.54 W/cm2 for 5 minutes. Data are presented as the mean ± SD, n = 3, * P < 0.05, ** P < 0.01, *** P < 0.001 compared with the negative control group; # # P < 0.01, # # # P < 0.001, compared with CDL treatment group).
