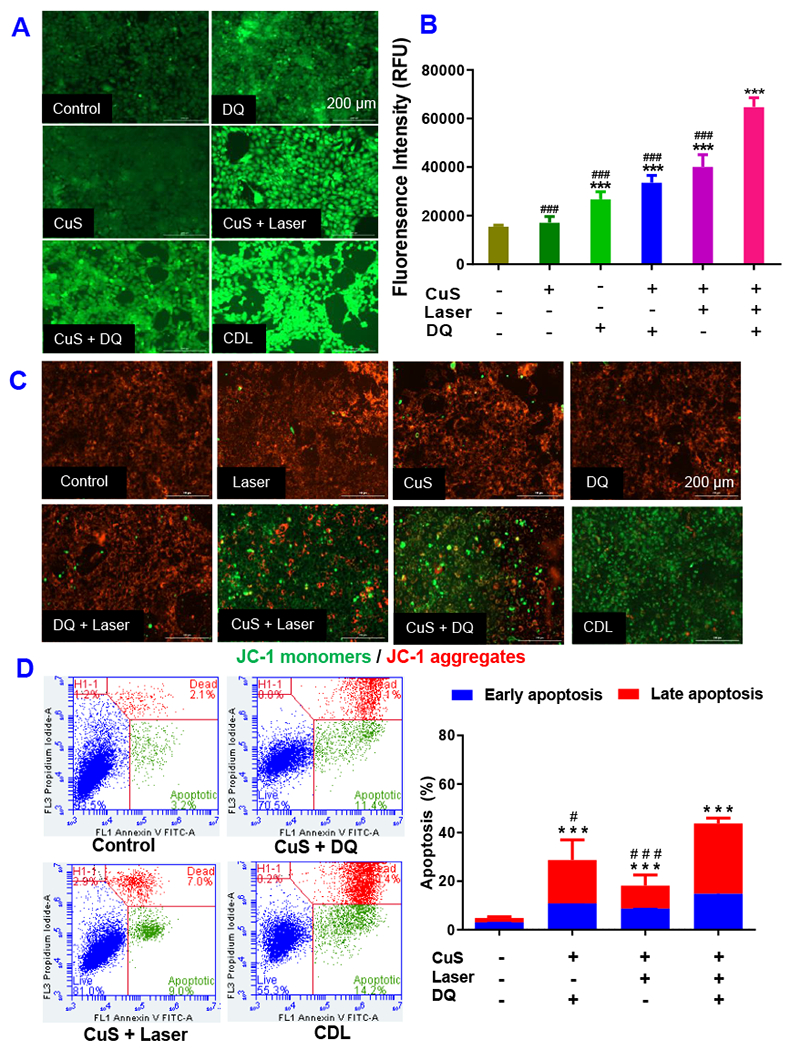
Figure 5.

Intracellular ROS levels of 4T1 cells receiving different treatments were determined with DCFH-DA dye based method. (A) Fluorescence image and (B) fluorescence intensity determined with fluorescence spectrometer. (C) The change of MMP was determined with JC-1 dye method. (D) Annexin V/PI apoptosis assay determine the percentage late-stage apoptotic cells (annexin V+/PI+) and early-stage apoptotic cells (annexin V+/PI−) with flow cytometry. (CuS, 0.1 mM; DQ, 2 μM Laser, 2.54 W/cm2 for 5 minutes. Data are presented as the mean ± SD, n = 3, *** P < 0.001 compared with the negative control. # P < 0.05, ### P < 0.001 compared with the CDL treatment group).
