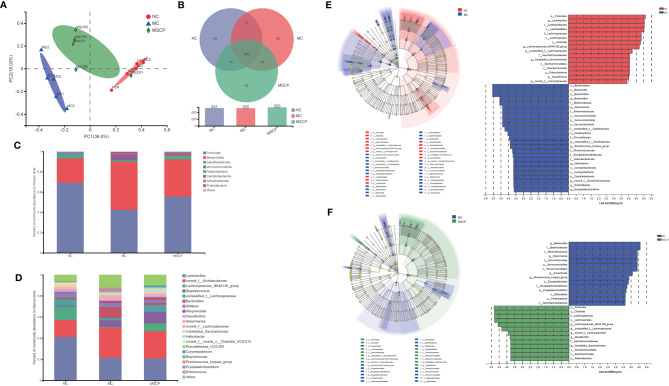
Figure 10.
MSCP treatments attenuated gut dysbiosis in CTX-induced mice. (A) Principal coordinate analysis (PCoA) of gut microbiota based on bray_curtis distance. (B) Similarity and difference of bacteria compositions in different experimental groups at the OTU level. (C) Relative abundance of microbiota at the phylum level. (D) Relative abundance of microbiota at the genus level. (E, F) Difference in dominant microorganisms among each group via cladogram and distribution histogram based on LDA. The greater the LDA score was, the more significant the phylotype microbiota was in the comparison. (E) NC group and MC group. (F) MC group and MSCP group. (A–F) Data are pooled in one independent experiment.

