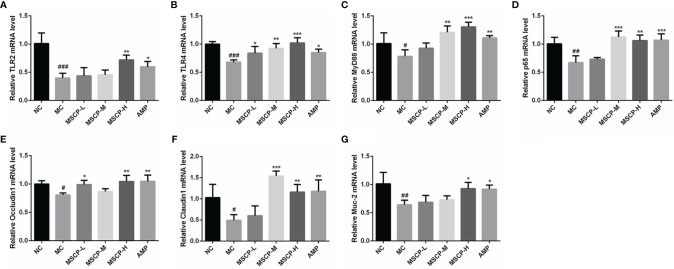
Figure 9.
Effects of the treatments of MSCP (100, 200 and 400 mg/kg· BW/d, respectively) and AMP (400 mg/kg· BW/d) on the relative mRNA expression of (A) TLR2, (B) TLR4, (C) MyD88, (D) p65, (E) Occludin1, (F) Claudin1 and (G) MUC-2 in small intestine tissues. Data are expressed as mean ± SD. #p < 0.05, ##p < 0.01, ###p < 0.001 compared with NC group; *p < 0.05, **p < 0.01, ***p < 0.001 compared with MC group.

