Figure 3.
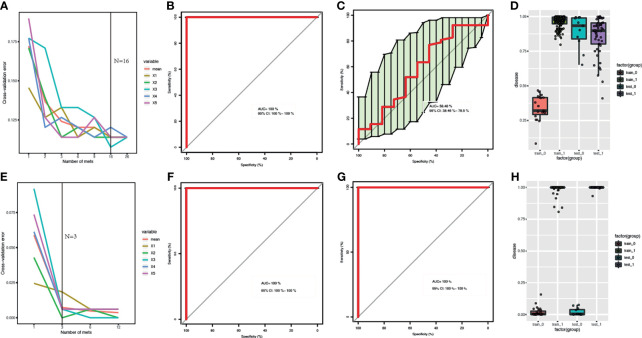
Comparison of RF models based on metagenomics and metabolome features: (A, E) Distribution of 5 trials of 10-fold cross-validation error in random forest classifier. The red solid curve showed the average of the 5 trials, the black solid line indicated the number of picked features in the optimal set. (B, C, F, G) ROC curve and AUC for the training and test datasets, respectively. (D, H) Box-and-whisker plot presented the risk probability of B-CS. (A-D) for B-CS faecal microbiota. (E–H) for B-CS serum metabolome. The metabolomics results showed that both the training datasets and test datasets performed perfectly with (AUC = 100 %, 95% CI: 100 % – 100 %) (F–H). We found that metagenomics performed relatively poorly on test datasets (AUC = 58.48 %, 95 % CI: 38.46 % – 78.5 %) (C, D), although the training datasets showed good performance (AUC = 100 %, 95 % CI: 100 % – 100 %) (B–D). RF, random forest; B-CS, Budd-Chiari syndrome; RF, random forest; ROC curve, Receiver Operating Characteristics curve; AUC, area under the curve; CI, confidence interval.

