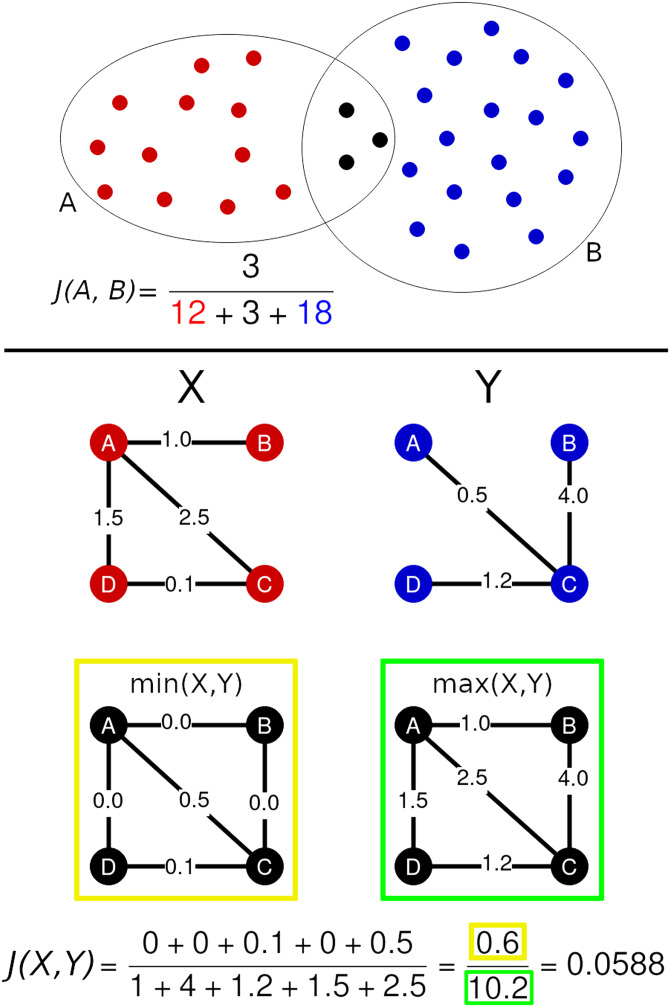
Figure 1. .
Top panel. The two sets contoured by the circles have a non-empty intersection marked by the black dots. The Jaccard similarity index between the two sets is the result of the ratio between the number of elements in the intersection and the number of elements in the union of the two sets. The resulting Jaccard index is equal to J = 3/33 ≈ 0.09. Bottom panel. This figure shows an example of how to compute the GJI between two compatible graphs X and Y. For each pair of nodes i, j ∈ {A, B, C, D}, one computes the minimum and maximum between Xi,j and Yi,j . These two quantities will be used to define the numerator and the denominator of the GJI defined in Equation 7. As shown in the min (yellow) and max (green) graphs, edges that are not in a graph are associated with a null weight. The GJI is then computed as the ratio between the sum of the minimal weights and the sum of the maximal weights.

