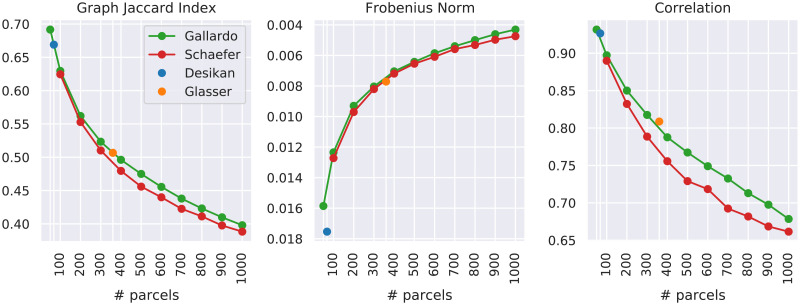
Figure 4. .
Each point shows the average similarity between every pair of subjects in the considered cohort measured on connectomes obtained with a specific parcellation. The alignment used is the one defined by the ground truth, which in our experiments is known a priori. All panels show the similarity measure as a function of the number of parcels of the considered atlas. A higher graph Jaccard index and correlation corresponds to higher similarity. On the contrary, a higher Frobenius norm corresponds to lower similarity. In order to keep the intuition that higher is better, the y-axis of the Frobenius norm is flipped.

