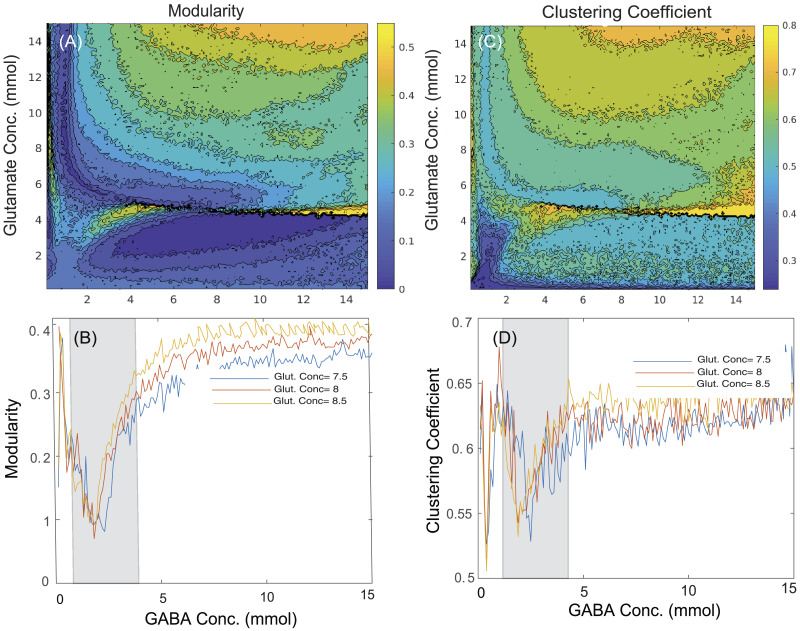
Figure 4. .
Contour plots showing the changes in network segregation measures such as (A) modularity and (C) clustering coefficient across various concentrations of GABA (0.1–15 mmol) and glutamate (0.1–15 mmol). The effect of changes in GABA concentrations ranging from 0.1 to 15 mmol at discrete values of glutamate concentration (7.5 mmol, blue line; 8 mmol, red line; 8.5 mmol, yellow line) is shown on network segregation measures including (B) modularity and (D) clustering coefficient. The shaded regions denote graph theoretical measures in homeostasis regime of GABA ranging from 1.5 to 4.2 mmol with discrete values of glutamate concentration (7.5, 8, or 8.5 mmol), whereas outside the shaded regions represents pathological scenarios.

