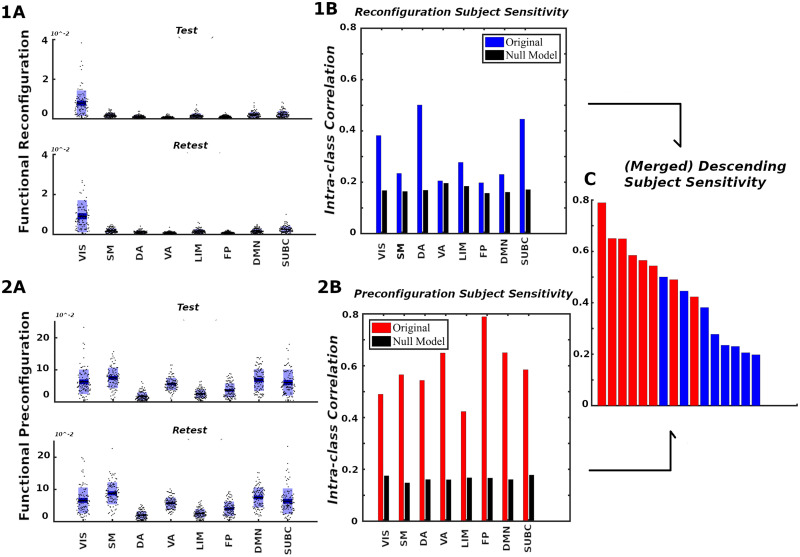
Figure 7. .
Network configural breadth, subject specificity analysis. Panels 1 and 2 show functional reconfiguration and preconfiguration, respectively, from both magnitude and subject-sensitivity viewpoints. For each functional network, the (A) panels report subject’s preconfiguration and reconfiguration values whereas the (B) panels quantify subject sensitivity. Reconfiguration and preconfiguration measures are displayed in blue and red, respectively. Panel (C) merges all 16 configural breadth terms in descending order of subject sensitivity.

