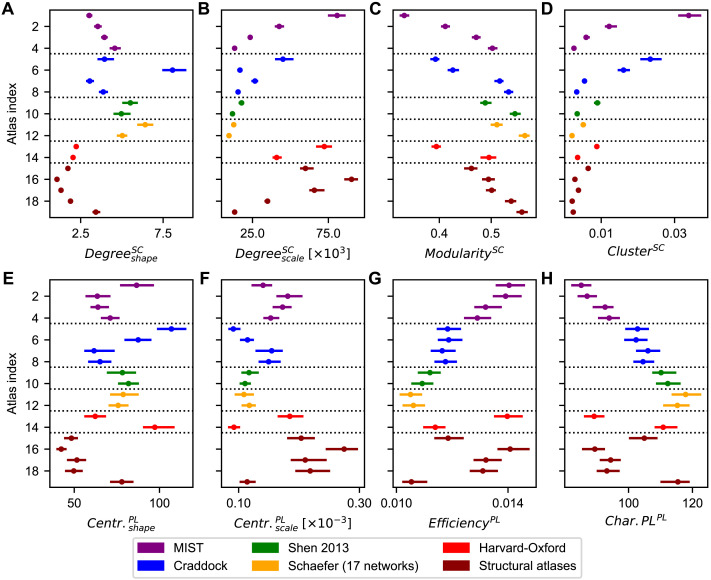
Figure 2. .
Heterogeneity of graph-theoretical properties of empirical structural networks across parcellations. (A–D) Statistics extracted from the structural connectivity (SC) matrices, which are the shape (A) and scale (B) parameters of the degree distributions, the modularities (C), and the clustering coefficients (D). (E–H) Statistics extracted from the path length (PL) matrices, which are the shape (E) and scale (F) parameters of the closeness centrality distributions, the global efficiencies (G), and the characteristic path lengths (H). Dots and lines depict the medians and interquartile ranges across subjects, respectively. The atlas indices on the vertical axes correspond to those in Table 1, which contains the information about the used parcellations. Abbreviations: Centr. = closeness centrality, Char.PL = characteristic path length.

