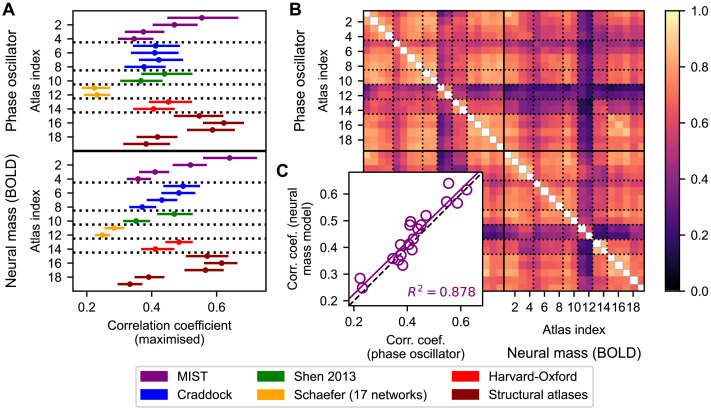
Figure 6. .
Goodness-of-fit of the whole-brain models based on coupled phase oscillators and neuronal mass models and their interrelations for the considered parcellation schemes. (A) Maximized correlations (goodness-of-fit) between the empirical and simulated FC matrices for the brain parcellation schemes and models investigated in this study as indicated on the vertical axes. Dots and lines depict the medians and interquartile ranges across subjects, respectively. (B) Correlations across subjects of the goodness-of-fit of the model between the considered parcellations and models. Table 1 contains the parcellation information corresponding to the atlas indices used in the plots. (C) Scatterplot of the medians of the goodness-of-fit corresponding to the phase oscillator (x-axis) and neural mass model (y-axis) across subjects. Each dot corresponds to a particular parcellation, the purple line portrays the linear regression between both types of goodness-of-fit, and the black dashed line corresponds to x = y.

