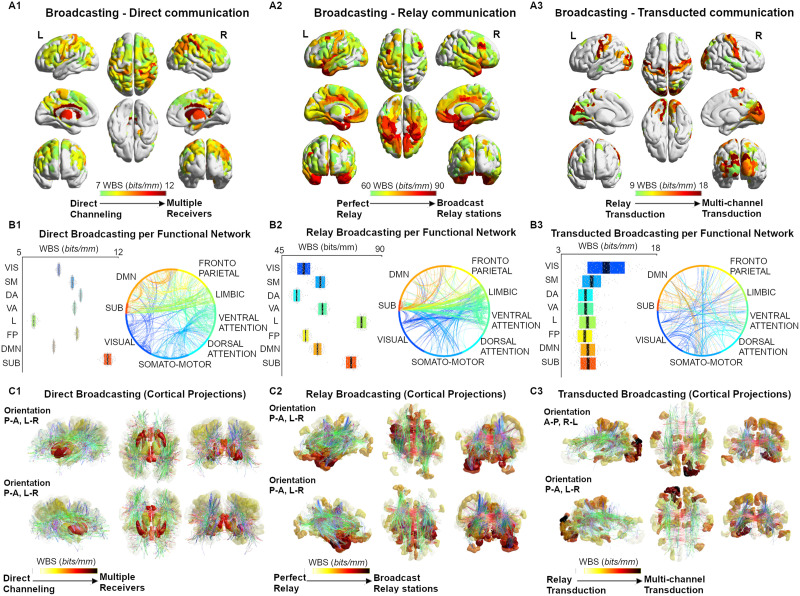
Figure 3. .
Broadcasting in large-scale brain networks during rest. (A1–A3) Nodal broadcasting strength (WBS, measured in bits/mm; see Methods section for details) shown for the top 100 brain regions for the three different communication regimes (direct communication, relay communication, transducted communication). (B1–B3) Broadcasting properties evaluated for each of the seven functional networks specified by Yeo et al. (2011). An eighth subcortical community was added for completeness. (C1–C3) The broadcasting matrices are projected onto brain renders, where tracts (color coded by direction; red: left-right; green: anterior-posterior; blue: superior-inferior) represent nonzero edges in the masks, and nodal strength (A1–A3) is mapped onto the cortical meshes from low WBS (white, transparent) to high WBS (opaque, bright red).

