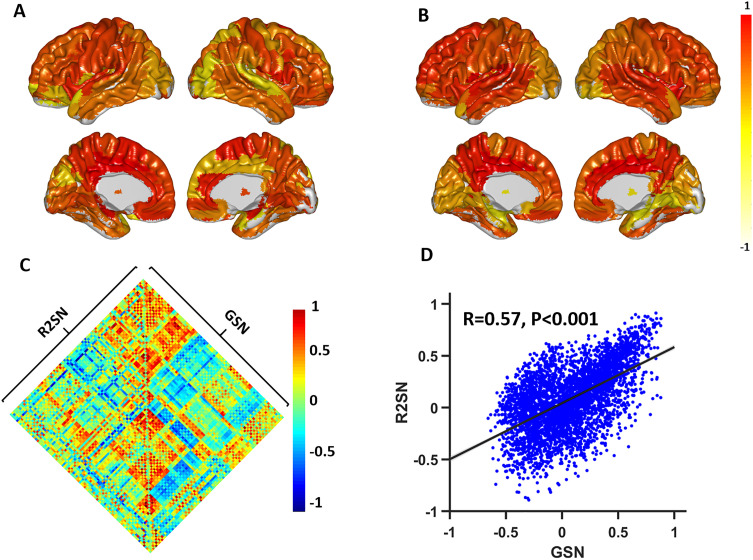
Figure 4. .
The correlation between the R2SN and the gene expression network. (A) The mean connective strength of the R2SN, which was mapped to the surface area from the AAL template. (B) The mean connective strength of the GSN, which was mapped to the surface area from the AAL template. The value of the color bar was normalized with the max-min method. (C) The heat map for the R2SN and GSN. Some negative correlations were generated with the GSN, and this phenomenon might have been caused by the deletion of genes in some brain regions. (D) The scatter diagram of the correlation between GSN and R2SN, where the Euclidean distance between each pair of regions of interest was employed as a concomitant variable within the network.

