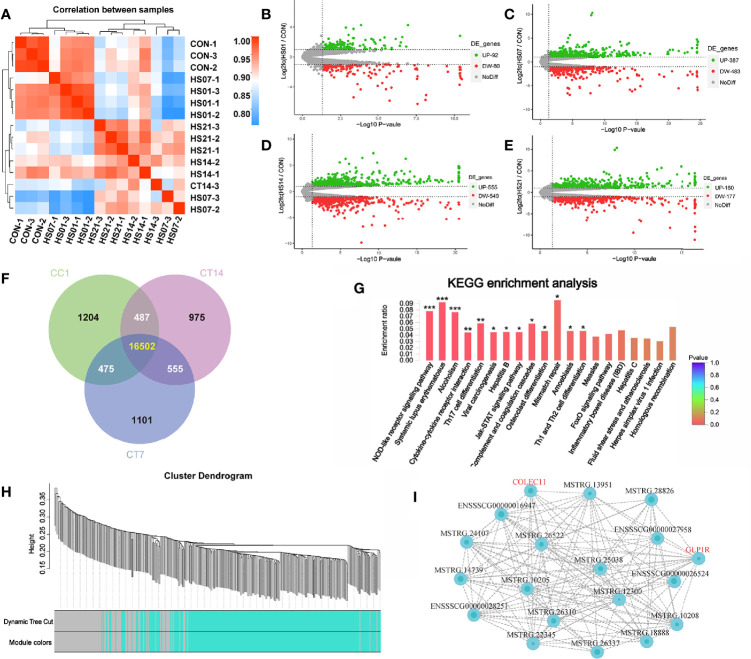
Figure 10.
Transcription sequencing analysis of HS pig colon. CON indicates no heat stress group of day 1, HS1, 7, 14, 21 indicate heat stress day 1, 7, 14, and 21 groups, respectively, n = 3. “*” means p<0.05, “**” means p<0.01, “***” means p<0.001; (A) distance heat map between samples; (B-E) expression difference volcano plots. (F) Venn analysis between groups, (G) difference gene KEGG enrichment analysis; (H) WGCNA modular analysis; (I) WGCNA module related gene interaction network of green module.

