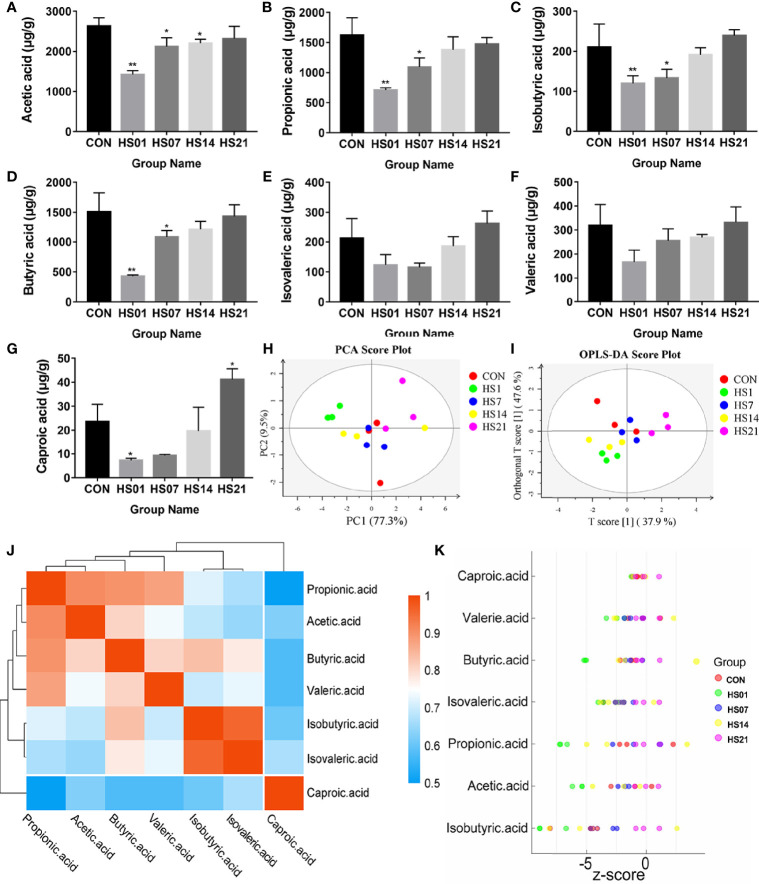
Figure 5.
Effect of HS on the metabolism of SCFAs in pig colon. CON indicates no heat stress group of day 1, HS1, 7, 14, 21 indicate heat stress day 1, 7, 14, and 21 groups respectively, n = 4; “*” indicates p < 0.05, and “**” indicates p < 0.01. (A) acetic acid; (B) propionic acid; (C) isobutyric acid; (D) butyric acid; (E) isovaleric acid; (F) valeric acid; (G) caproic acid; (H) PCA analysis between short-chain fatty acid samples; (I) short-chain OPLS-DA analysis between fatty acid samples; (J) metabolite correlation analysis; (K) Z-score analysis.

