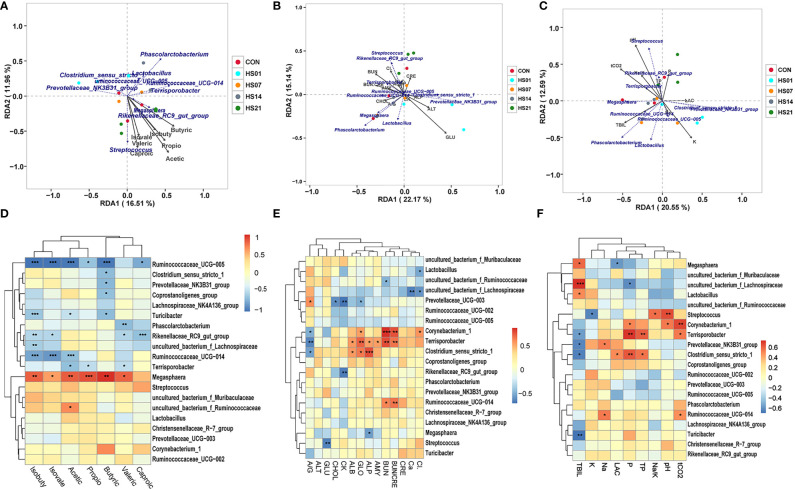
Figure 9.
Correlation analysis of microbiome and metabolites. “*” means p < 0.05, “**” means p < 0.01, “***” means p < 0.001; (A–C) RDA/CCA correlation analysis of metabolites and microorganisms; (D–F) heat map of metabolites and microbiotas correlation. Sorry, I don’t know how to analyze this, can you provide the corresponding references.

