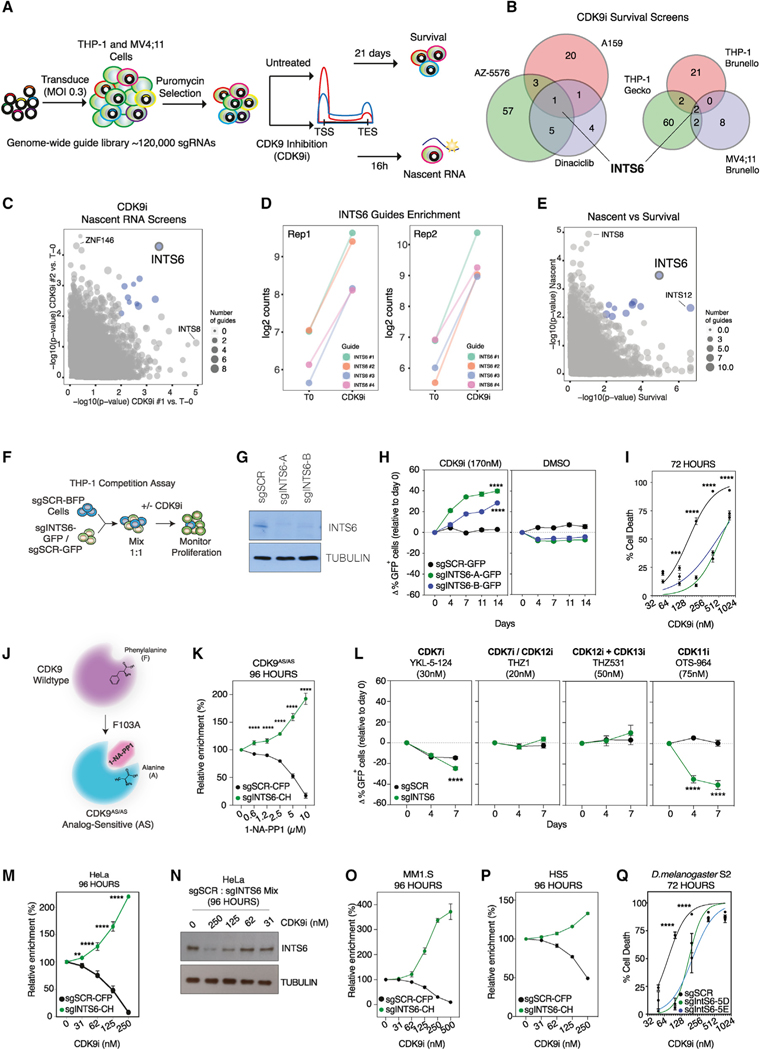
Figure 1. Loss of INTS6 confers resistance to CDK9 inhibition.
(A) CRISPR-Cas9 genome-wide screens: Cas9-THP-1 and MV4;11 cells were transduced with a genome-wide sgRNA library and cultured with DMSO or CDK9i for 21 days (survival) or 16 h (nascent RNA).
(B) Enriched sgRNAs (CDK9i versus untreated; Tend) in THP-1-Cas9 survival screens using different CDK9 inhibitors (left) and sgRNA libraries (right), adjusted p value <0.1 for >3 sgRNAs.
(C) Enriched sgRNAs for THP-1-Cas9 nascent RNA screens (significance relative to T0).
(D) Enrichment of INTS6 targeting sgRNAs in CDK9i-treated THP-1-Cas9 cells.
(E) Comparison of enriched sgRNAs for nascent RNA and survival screens.
(F) Competitive proliferation assays for (H) and (L); cells expressing Cas9 and GFP/BFP-sgRNAs were mixed 1:1 and cultured with DMSO or under selective pressure.
(G and H) Western blot (G) and competitive proliferation assay (H) for THP-1-Cas9 cells expressing indicated sgRNAs and treated as indicated.
(I) Annexin-V analysis of THP-1-Cas9 cells expressing indicated sgRNAs.
(J) Schematic of analog-sensitive (AS) mutant CDK9 (CDK9AS/AS) bound by the inhibitory ATP analog 1-NA-PP1.
(K) Competitive proliferation assay for THP1 CDK9AS/AS cells expressing CFP-Cas9/sgSCR or mCherry(CH)-Cas9/sgINTS6 treated with 1-NA-PP1.
(L) Competitive proliferation assay for THP-1-Cas9 cells expressing indicated sgRNAs treated with indicated CDK inhibitors.
(M) Competitive proliferation assay for HeLa cells expressing CFP-Cas9/sgSCR or CH-Cas9/sgINTS6 treated with CDK9i.
(N) Western blot of HeLa cells expressing sgSCR or sgINTS6 (mixed) treated with CDK9i.
(O and P) Competitive proliferation assay for (O) MM1.S and (P) HS5 cells expressing CFP-Cas9/sgSCR or CH-Cas9/sgINTS6 treated with CDK9i.
(Q) Annexin-V analysis of D. melanogaster S2-Cas9 expressing SCR or IntS6 sgRNAs.
Blue dots (C and E) represent nominal p value <0.01. (G)–(I), (K)–(N), and (Q) are representative of 3 experiments. (O) and (P) are representative of 2 experiments. (H), (I), (K)–(M), and (Q) were analyzed by 2-way ANOVA, **p < 0.01, ***p < 0.001, ****p < 0.0001.

