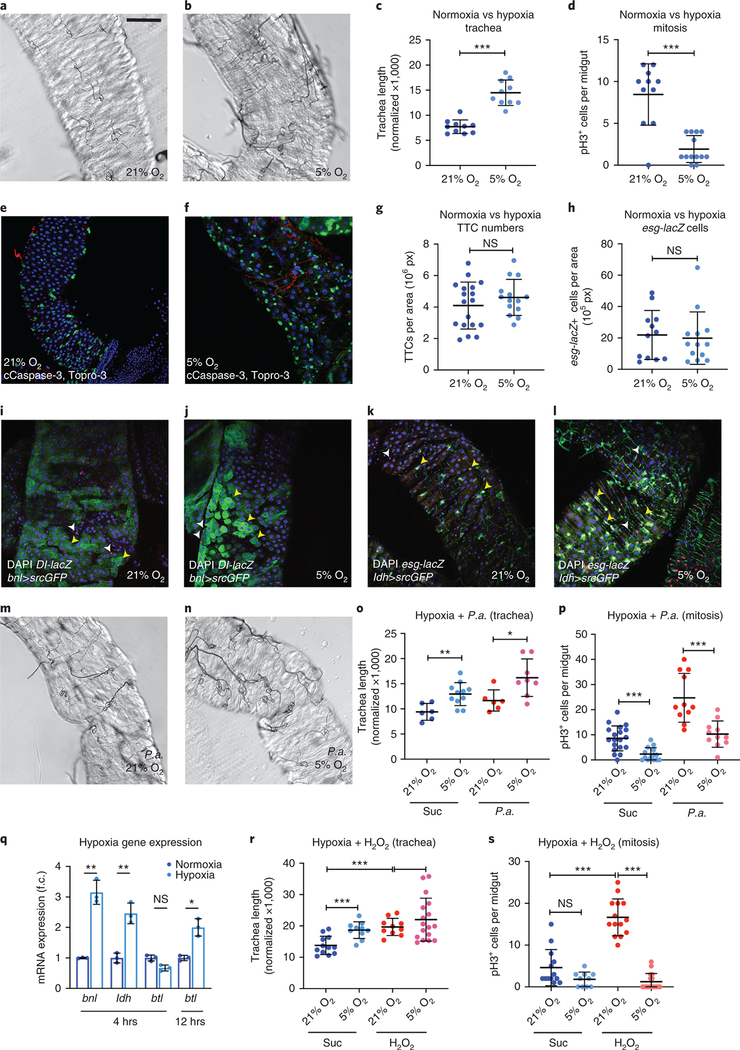
Figure 5. Hypoxia induces TTC branching, but not ISC proliferation.
a-b. Brightfield images of the midgut TTCs (R5 region) of wild-type (w1118) uninfected flies reared in normoxia (21% O2) vs. hypoxia (5% O2). c-d. Quantification of TTC branching (c, n=10 each) and mitosis (d, n=11,13) in normoxia vs. hypoxia. e-f. esg-Gal4>UAS-srcGFP (ISCs+EBs, green) midguts (R5 region) of flies reared in normoxia (e) and hypoxia (f) stained for cleaved Caspase-3 (red) and Topro3 (blue) staining all nuclei. g-h. Quantification of TTCs (g, n=18, 14) and esg-lacZ+ progenitors (h, n=12,13) in normoxia and hypoxia. i-j. Fluorescence images showing normoxia- (i) and hypoxia-reared (j) bnl-Gal4>UAS-srcGFP (Bnl reporter, green) midguts with Dl-lacZ (red) labeling the ISCs and DAPI (blue) staining all nuclei. Yellow arrowheads indicate bnl-positive and Dl-positive progenitors and white arrowheads indicate bnl-negative and Dl-positive progenitors. k-l. Fluorescence images showing normoxia- (k) and hypoxia-reared (l) ldh-Gal4>UAS-srcGFP (Sima reporter, green) midguts with esg-lacZ (red) labeling the ISCs and EBs and DAPI (blue) staining all nuclei. Yellow arrowheads indicate bnl-positive and esg-positive progenitors and white arrowheads indicate bnl-negative and esg-positive progenitors. m-n. Brightfield images of the midgut TTCs (R5 region) of wild-type (w1118) P.a.-infected flies reared in normoxia (21% O2) vs. hypoxia (5% O2). o-p. Quantification of TTC branching (o, n=6,11,6,8) and mitosis (p, n=19,14,11,11) of uninfected and P.a.-infected flies in normoxia and hypoxia. q. RT-qPCR analysis of btl, bnl and ldh in normoxia vs. hypoxia. The average and standard deviation of n=3 biological experiments are shown. r-s. Quantification of TTC branching (r, n=12,10,10,17) and mitosis (s, n=13,10,14,17) of untreated vs. H2O2-fed flies in normoxia and hypoxia. All scale bars: 75 μm. Data are presented as mean values ± SD. Statistical significance (t-tested, two-sided, and U-tested for o): ns, not significant, * 0.01<p≤0.05, ** 0.001<p≤0.01 and *** p≤0.001.

