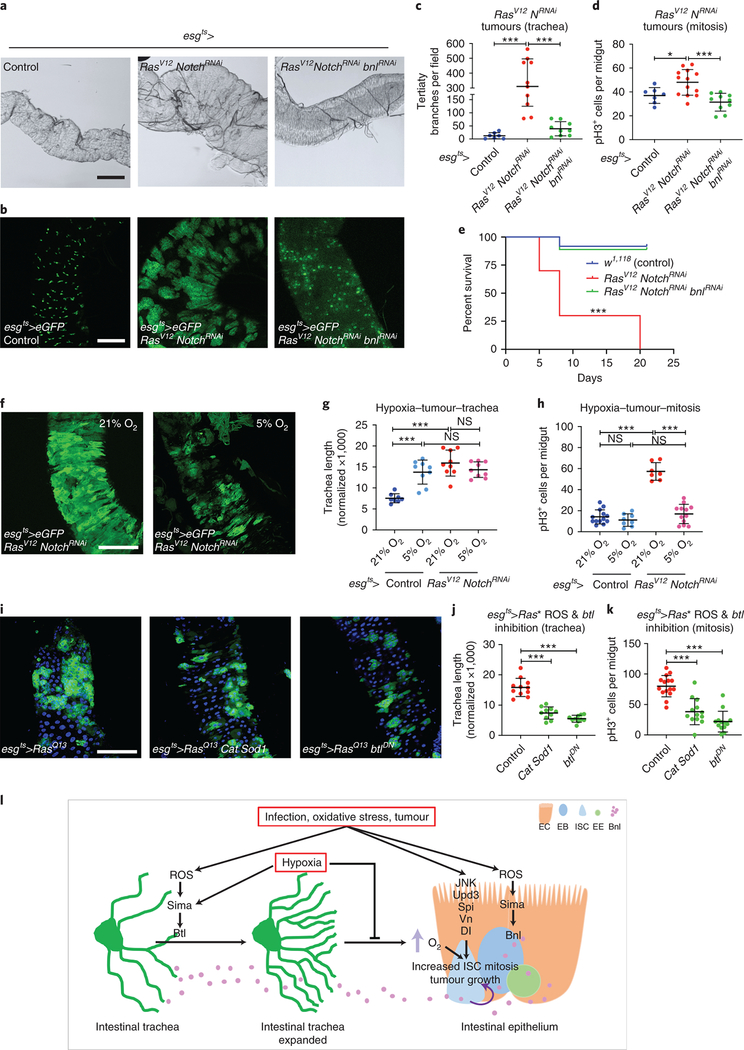
Figure 8. Tumor-induced increased tracheal coverage, oxygen supply, and ROS are necessary for tumor growth.
a-d. Brightfield images of the TTCs (a) and fluorescent images of the GFP-positive (b) progenitor or progenitor derived tumor cells in control midguts, midguts bearing esg-Gal4 UAS-eGFP tub-Gal80ts>UAS-RasV12 UAS-NotchRNAi tumors, and esg-Gal4 UAS-eGFP tub-Gal80ts>UAS-RasV12 UAS-NotchRNAi co-expressing UAS-bnlRNAi. Quantification of TTC branching (c, n=7,10,11) and mitosis (d, n=7,13,10) in control, RasV12 NotchRNAi and RasV12 NotchRNAi bnlRNAi tumor-bearing flies. e. Percent survival of control, RasV12 NotchRNAi and RasV12 NotchRNAi bnlRNAi tumor-bearing flies (n=160,78,120). f-h. Images showing growth of RasV12 NotchRNAi tumors (f), quantification of TTC branching (g, n=8,9,9,9) and midgut mitosis (h, n=13,8,7,12) in control and RasV12 NotchRNAi tumor-bearing flies in normoxia vs. hypoxia. i-k. Images showing tumorous midguts (R5 region) with progenitor derived RasQ13 tumors (green) with Cat and Sod1 overexpression or btl knockdown. Quantification of TTC branching (j, n=11,10,10) and midgut mitosis (k, n=15,13,13) in the same genotypes. Scale bars: 200 μm in a, 100 μm in b and 75 μm in f and i. l. Model of the intestinal trachea-midgut communication during damage-induced regeneration. Data are presented as mean values ± SD. The Kaplan-Meier method was used to test significance in e. For all others, a two-sided t-test was used: ns, not significant, * 0.01<p≤0.05, ** 0.001<p≤0.01 and *** p≤0.001.

